Scenario Analysis: How Could a Credit Crisis Affect Portfolios?
Key findings
- Credit risk has risen along with interest rates. We explore a downside scenario in which a pullback in credit triggers a sell-off, particularly hurting companies with high leverage and the banking sector.
- The potential impact on a diversified portfolio of global public and private equities, U.S. bonds and real estate loses 17% under our scenario.
- Market fragility, especially due to illiquidity, could worsen a sell-off. Given the growth of the private credit market, investors aiming to reduce credit exposure might have to liquidate more assets in public markets.
A pullback in credit and a demand for higher collateral requirements stemming from the shift to higher interest rates and increased credit risk could trigger a downward cascade in financial markets — creating a vicious cycle of reduced spending, investment and growth. We put forward a scenario for how a sudden disruption in credit markets could affect portfolios, especially given indications of the market's fragility.
Scenario narrative
A sudden economic downturn exacerbated by a rise in interest rates precipitates a credit shock. Companies already operating on thin margins and (often) within sectors facing structural challenges struggle to meet their debt obligations.
At the same time, there is a pullback in credit and a demand for higher collateral requirements. As investors allocate away from credit exposure, credit spreads widen. Contagion moves into the equity markets, particularly into companies with high leverage, high short-term borrowing and weak balance sheets.
To evaluate this scenario, we look at past crises driven by macroeconomic events.[1] We use a broad equity-market sell-off of 25%, which corresponds to the historical average loss over these types of events.
From a factor standpoint, companies with high leverage and low earnings quality will be affected more than the broad market under our scenario. Regional banks, a key source of credit for businesses and real-estate financing in their local areas, will be hit harder as many have significant exposure to commercial real estate and small to medium-sized enterprise lending, both vulnerable to a credit shock.[2] These banks may face liquidity risks that force them to sell assets at depressed prices, further weakening their financial position.
For the 10-year U.S. sovereign yield, the historical data shows a wide range of potential outcomes. We have a yield drop of 75 basis points (bps) in our scenario, as the economy faces headwinds.
Scenario definition
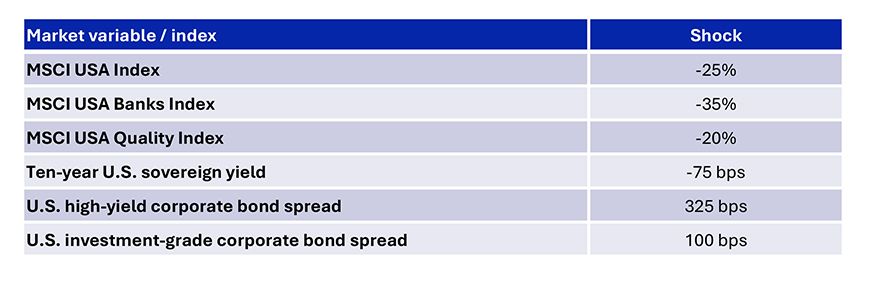
Scenario assumptions are informed by analysis of historical data and judgment. This is not a forecast, but a hypothetical narrative of how the scenario could affect multi-asset-class portfolios.
Portfolio implications
To evaluate the scenario's impact on multi-asset-class portfolios, we apply MSCI's predictive stress-testing framework to a hypothetical portfolio consisting of global public and private equities, U.S. bonds and U.S. private real estate.[3] Such a portfolio loses 17% under the credit scenario.[4] Consistent with the narrative, equity-market sectors, such as real estate and consumer discretionary, sell off more sharply than others. More generally, cyclical sectors and small-cap stocks underperform the broad market, while defensive sectors, low-volatility and high-quality stocks sell off less sharply.
Portfolio impact by asset class, sectors and styles
Loading chart...
Please wait.
Portfolio impact of the scenario based on market data as of June 17, 2024. U.S. style and sector performance is measured relative to the MSCI USA Index. Source: S&P Global Market Intelligence, MSCI
Scenario path
While the effects above are based on "instantaneous" repricing, the risk from any scenario is not just one number: Scenarios unfurl over a trajectory, not a single instance. This consideration is crucial for effective planning, portfolio adjustments and maintaining alignment with financial goals. To account for this fact, we used MSCI Fabric to simulate 2,000 potential paths, parameterized to match the average loss of 25%, a time to bottom of around nine months and a time to recovery of approximately 16 months.[5] The exhibit below shows the median and the envelope around it to give a sense of how this scenario may play out.
Simulated paths for US equity-market performance under a credit-crisis scenario
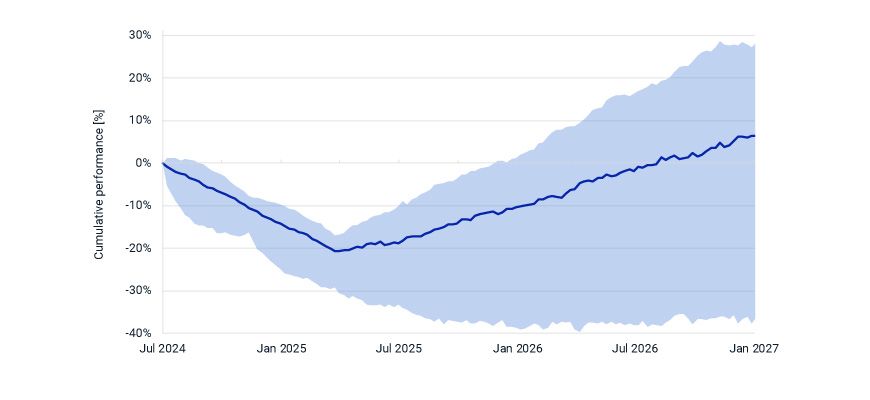
The chart shows the ensemble of trajectories for the MSCI USA Index. The blue line shows the median, while the shaded area shows the 25th and 95th percentiles over a set of 2,000 simulated paths. Source: MSCI Fabric
Commentary
If the market is fragile when the credit crisis occurs, the scenario's effects will be more severe, and markets will hit bottom more quickly. The center of fragility for the credit scenario is illiquidity, which forces prices down as demand to sell hits the market. The major source of the illiquidity is private credit.
When it comes to risk, private credit hits the trifecta. Being credit, you get the distributional characteristics you least want. Being private, you are in a more opaque market and valuations can be subjective and infrequently updated, masking underlying financial distress. And it is illiquid, with lockups of years. The liquidity issues stem from private credit because investors have no other choice but to disproportionally liquidate their public-credit holdings to achieve their desired reduction in overall exposure. The larger the private market, the greater the strain on public markets and the risk that prices cascade down.
This last point is key, because private credit, once a niche market, has grown rapidly and now commands over USD 1.7 trillion in assets under management. In the U.S., the private-credit market is currently comparable to the high-yield-bond and leveraged-loan markets in size.[6]
Fragility also can come from concentration and leverage, both of which currently are notable. Free cash flow less margin debt is at one of the lowest points in the past 25 years, and the market capitalization of the 10 largest stocks in the MSCI USA Index has surged to more than 30% of the total market cap of the index, approaching its highest level in the last 25 years.[7]
Credit risk is multi-pronged, affecting a wide swath of the financial markets directly, and indirectly through its effect on borrowing and security financing. With the recent surge in private credit, this extends even further, and in ways that are difficult to divine. Currently the credit markets appear unchallenged, but such is the nature of risk in these markets; there is little warning until a credit crisis is in full swing. The scenario analysis here provides some hooks to address a possible credit event in a portfolio.
The authors thank Dhruv Sharma for his contributions to this blog post.


Subscribe todayto have insights delivered to your inbox.
1 We identified 14 U.S. market sell-offs since 1946 that were driven by macroeconomic events and registered the maximum drawdown, the time to bottom and the time to recovery. We used the MSCI USA Index to proxy historical U.S. equity-market performance since 1972 and the Fama-French benchmark for the largest market-capitalization quintile of U.S. stocks prior to 1972.2 Laura Benitez, “Pimco Warns of More Regional Bank Failures on Property Pain,” Bloomberg, June 11, 2024.3 Treasury inflation-protected securities are represented by the iBoxx TIPS Inflation-Linked Index provided by S&P Dow Jones Indices. U.S. Treasurys, equities and corporate bonds are represented by MSCI indexes. Private equity is represented by model portfolios. U.S. real estate is represented by the MSCI/PREA U.S. AFOE Quarterly Property Fund Index. The composite portfolio is 42% global public equities, 12% global private equities, 20% U.S. Treasurys, 20% U.S. high-yield bonds and 6% U.S. real estate.4 The results are generated by using model correlations to propagate shocks to the portfolios, using MSCI's BarraOne®. MSCI clients can access BarraOne and RiskMetrics RiskManager® files for these scenarios on the client-support site.5 Based on the historical events we identified, there was a wide dispersion in the time it took until the equity market reached its bottom, ranging from one to 21 months, with an average of nine months. The time to recovery (counted from the bottom) also saw large variations, ranging from five to 36 months, with an average of 16 months.6 Global Financial Stability Report, “The Last Mile: Financial Vulnerabilities and Risks,” International Monetary Fund, April 2024.7 Free cash flow less margin debit is based on margin statistics collected by FINRA from its member firms. Concentration is based on market-capitalization weights in the MSCI USA Index.
The content of this page is for informational purposes only and is intended for institutional professionals with the analytical resources and tools necessary to interpret any performance information. Nothing herein is intended to recommend any product, tool or service. For all references to laws, rules or regulations, please note that the information is provided “as is” and does not constitute legal advice or any binding interpretation. Any approach to comply with regulatory or policy initiatives should be discussed with your own legal counsel and/or the relevant competent authority, as needed.