
Scenario Analysis: Two Routes to Higher Treasury Yields
- The path to a further rise in the 10-year Treasury yield can hit portfolios very differently: Policy repricing could produce a broad bond sell-off, while a higher term premium concentrates losses in long-duration assets.
- For non-USD investors, the source of the yield rise matters twice. It changes where losses fall across assets and whether currency moves cushion or amplify them.
- Asset allocators may want to take note: A dollar-based multi-asset-class portfolio loses about 11% under both scenarios, but a euro-based investor loses 5% under policy repricing and 12% under term-premium repricing.
Mentioned in this blog post:
MSCI Multi-Asset Class Factor Model | BarraOne® | RiskMetrics® RiskManager®
Many investors attribute the 10-year U.S. Treasury yield's rise above 5% for the first time since 2007 to heavy government borrowing, which could push up long-term yields as investors demand a higher term premium. So far, however, the rise has come mainly through real rates rather than inflation: Front-end moves point to expectations of tighter Federal Reserve policy, while the climb in 30-year yields hints that investors may also want more compensation to hold long-term debt.
To help multi-asset-class investors plan their way forward, we model a further rise of about 100 basis points (bps) in the 10-year yield through two scenarios. The headline loss for a USD-based portfolio is similar in both scenarios, but they differ in where the loss concentrates and what happens to the dollar: A stronger dollar cushions losses for non-USD investors in one scenario, but not in the other.
Between February and October, yields rose broadly across maturities, driven overwhelmingly by real rates rather than by inflation compensation. This pattern suggests that investors were pricing in less Federal Reserve easing and possibly more compensation for holding long-term debt.
Change in yield between Feb. 27 and Oct. 8, 2026. Real rate is the nominal Treasury rate minus the breakeven-inflation rate of the same tenor.
We model two hypothetical paths to higher Treasury yields. Both scenarios assume the same backdrop: With the Iran war unresolved, oil prices climb further, lifting near-term inflation expectations, while long-run expectations rise only modestly and growth slows. Both scenarios lift the 10-year Treasury yield by roughly 100 bps, but they differ in what happens to short-term yields and the dollar.
Our policy-repricing scenario centers on the Fed’s response to higher inflation. Investors conclude that the oil shock risks spilling into core prices and that the Fed has more tightening to do than it has signaled. The front end leads the whole curve higher, flattening it and leaving the long end comparatively protected. Higher U.S. policy rates make dollar assets more attractive relative to those in other currencies, drawing capital into the U.S. and strengthening the dollar against the euro.
In the term-premium-repricing scenario we focus on concerns about the U.S. fiscal outlook. The short end barely moves; the one-year Treasury yield even edges lower as markets price in slightly less tightening amid slower growth, yet the long end rises sharply. Historically, when a slowdown is driven by weak demand, investors expect lower inflation and lower policy rates, so long-term yields fall. In this scenario, however, that pull is outweighed by a higher term premium: With heavy government borrowing, investors demand more compensation to hold long-term government debt, so long-term yields rise even as growth weakens. Such a move could be abrupt, as price-sensitive buyers such as hedge funds have become increasingly important while foreign central banks have come to hold a smaller share of Treasurys, and they can pull back quickly under stress.1 Because the rise reflects investors' reluctance to hold U.S. government debt rather than higher policy rates, the dollar weakens slightly against the euro.
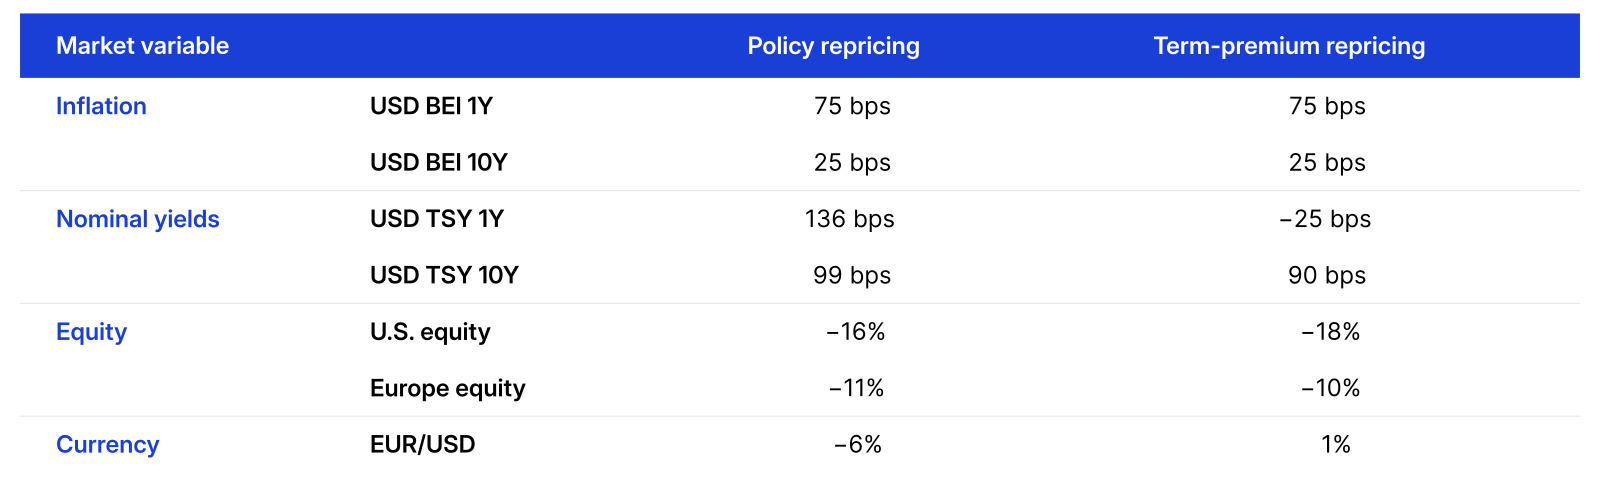
Breakeven inflation (BEI) is measured in basis points. Assumptions about risk-factor shocks are informed by the MSCI Macro-Finance Analyzer and by analysis of historical data and judgment. Macro shocks are measured relative to the MSCI Macro-Finance Analyzer baseline scenario as of June 30, 2026. This is not a forecast, but a hypothetical narrative of how the scenarios could affect multi-asset-class portfolios.
To assess the scenarios' impact, we used MSCI's predictive stress-testing framework and applied the shocks above to a hypothetical multi-asset-class portfolio consisting of global equities, U.S. bonds, private equity, private credit and real estate.2
For a U.S. dollar-based investor, the composite portfolio loses about 11% in both scenarios, but for different reasons. Policy repricing hits bonds across the curve, while term-premium repricing concentrates losses in long-duration assets, including U.S. equities, which lose almost 19%. For a euro-based investor, however, the outcomes diverge sharply. The composite portfolio loses 5% under policy repricing, as a stronger dollar cushions the loss, but loses 12% under term-premium repricing, as a weaker dollar amplifies the loss, with the difference driven by dollar assets.
Portfolio impact of the scenarios for U.S. dollar- and euro-based investors based on market data as of Sept. 29, 2026. Source: S&P Global Market Intelligence, MSCI
The shape of the shock matters. Stress testing the underlying shock, not just the size of the rise in yields, helps make risks visible, particularly across duration and currency exposures, and helps investors see their way forward.


Subscribe todayto have insights delivered to your inbox.
The Limits of AI Debt as a Driver of Treasury Yields
Rising AI bond issuance may have lifted Treasury yields, but widening hyperscaler spreads, higher CDS costs and banks’ exposure limits could constrain future issuance and reduce its impact on yields.
Investment Trends in Focus: Midyear Update 2026
AI, not geopolitics, drove markets in 2026’s first half. But the gains were narrow, and the equity risk premium has hit its lowest point since the dot-com era.
Scenario Analysis: How Could Soaring US Debt Impact Markets?
Soaring U.S. government debt could trigger market losses from rising yields or inflation from a politicized Federal Reserve, or gains with fiscal discipline.
1 Daniel Beltran and Canlin Li, “Estimating Yield Impacts of Treasury Demand and Supply Changes,” International Finance Discussion Papers 1447, Board of Governors of the Federal Reserve System, September 2026.
2 The results are generated by using model correlations to propagate shocks to the portfolios, using MSCI's BarraOne®. MSCI clients can download the correlated BarraOne stress test and RiskMetrics® RiskManager® stress test. Note that the above stress-test results capture the effect of repricing the assets, not the income component. Treasury inflation-protected securities (TIPS) are represented by the iBoxx TIPS Inflation-Linked Index provided by S&P Dow Jones Indices. U.S. Treasurys, equities and corporate bonds are represented by MSCI indexes. Private equity and private credit are represented by model portfolios. U.S. real estate is represented by the MSCI/PREA U.S. AFOE Quarterly Property Fund Index. The composite portfolio is 35% global public equities, 24% U.S. Treasurys, 2% TIPS, 12% U.S. investment-grade bonds, 2% U.S. high-yield bonds, 10% U.S. real estate and 15% global private assets (13% private equity, 2% private credit).
The content of this page is for informational purposes only and is intended for institutional professionals with the analytical resources and tools necessary to interpret any performance information. Nothing herein is intended to recommend any product, tool or service. For all references to laws, rules or regulations, please note that the information is provided “as is” and does not constitute legal advice or any binding interpretation. Any approach to comply with regulatory or policy initiatives should be discussed with your own legal counsel and/or the relevant competent authority, as needed.