Strategic Themes Behind China's Onshore-Offshore Divergence

Blog post
7 min read
September 30, 2026
Key findings
  • China's onshore market outperformed offshore by 28 percentage points in the first half of 2026. Unlike past episodes, this gap was also notably driven by industry and company composition rather than merely by macro forces.
  • China onshore market's greater exposure to strategic industries and physical AI infrastructure drove this divergence, as traced through MSCI's equity model, thematic investing tools and AI value chain dataset. 
  • Sector and thematic exposure selection could matter as much as the overall onshore/offshore allocation call, particularly where fundamentals and valuations have diverged within segments.

Mentioned in this blog post:

Strategy Explorer | Equity Factor Models

Since October 2025, China's onshore (A-share) and offshore markets have parted ways. Allocation explains much of the gap, but structural factors mattered more this time than in past episodes. The segmentation of China's onshore and offshore stock markets, with their different liquidity conditions, investor bases, regulatory environments and listed companies has long shaped the distinctive character of China equities. It has produced sharp A-share outperformance before: the strong A-share rally of the second half of 2014 to the first half of 2015 (2H2014 to 1H2015), driven by the domestic liquidity boom, as well as the deeper offshore decline of 2021 to October 2022, when the offshore market was hit harder by global liquidity tightening, ADR de-listing risks and internet-platform regulatory headwinds.
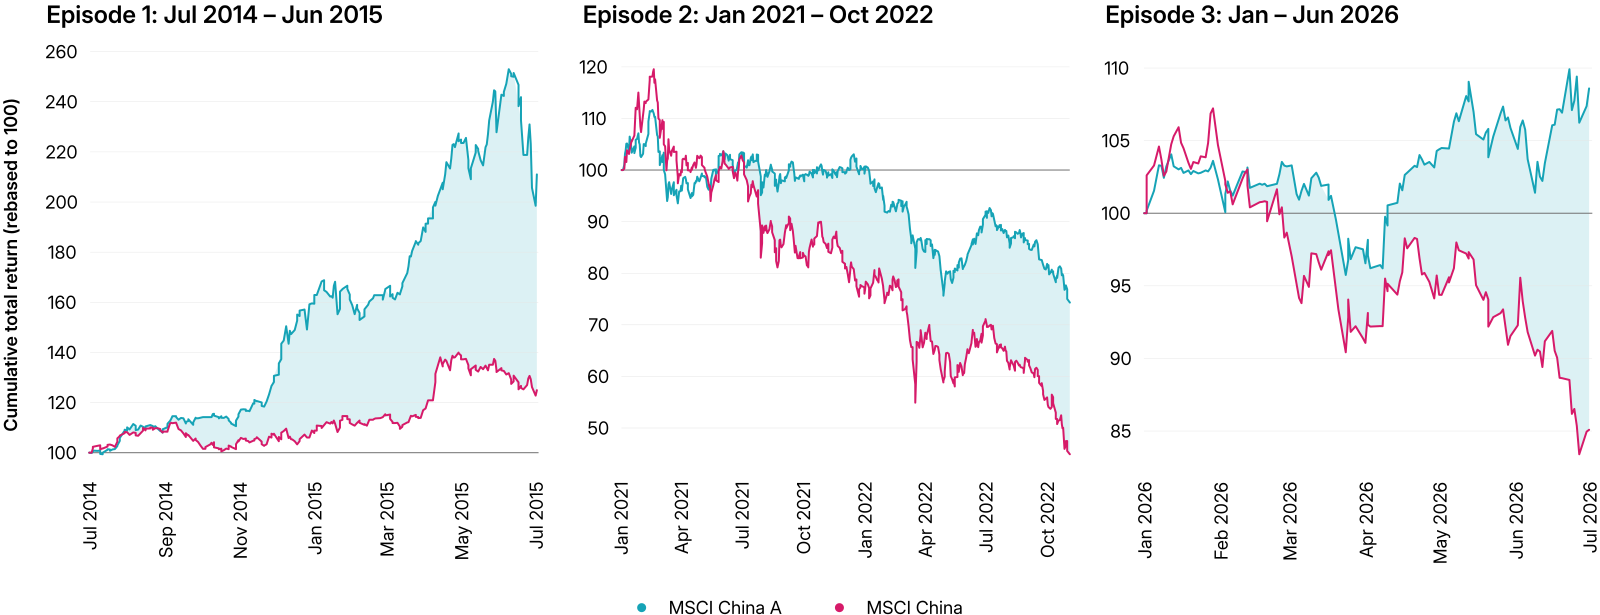
Three episodes of sharp onshore outperformance
Cumulative local returns of MSCI China A and MSCI China indexes, across three episodes of rapid onshore outperformance from July 2014 to June 2015, January 2021 to October 2022 and January to June 2026. For context, the total returns of the MSCI EM Index were −5%, −31% and +24%, respectively, over these episodes.
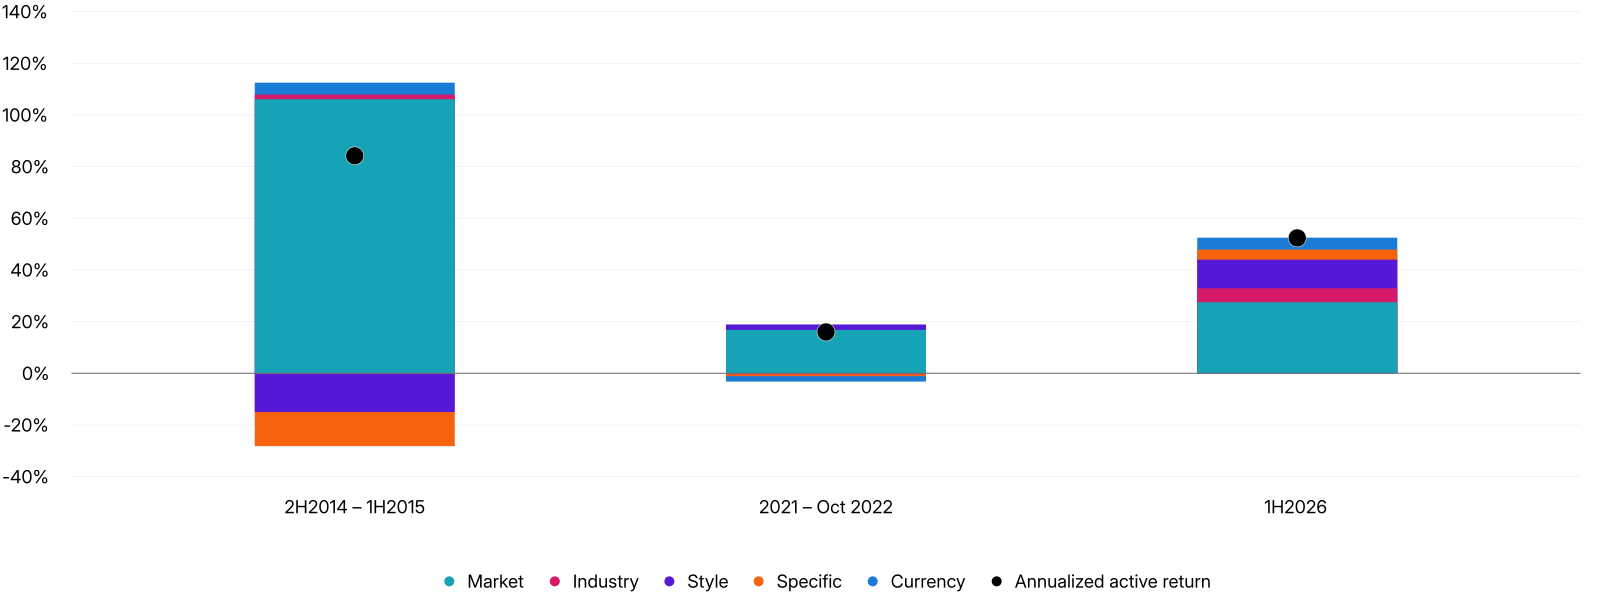
The DeepSeek moment in early 2025 lifted sentiment on the China market as a whole, but the benefits were unevenly distributed.1 Starting in October 2025, the MSCI China A Index (100% A-shares) began to outperform the MSCI China Index (dominated by Chinese companies listed in Hong Kong and the U.S.), and the gap widened sharply in the first half of 2026 by 28 percentage points. Unlike previous episodes, when the market factor (which simply captures that A-share is a different market from the China offshore market) was effectively the sole driver of A-share outperformance, this time, style and industry factors contributed 21% and 10% of the active return, respectively. The right market-allocation call is therefore no longer enough on its own: Capturing the opportunity also depends on holding the right sector and thematic exposures.
Sector and style, not just onshore vs offshore, drove the gap this time
Active return decomposition, MSCI China A vs MSCI China, across three episodes of rapid onshore outperformance from July 2014 to June 2015, January 2021 to October 2022 and January to June 2026. Based on Barra All China Equity Model (ACH1L) and HKD as base currency. Segment labels show each driver's contribution to the annualized active return.
Strategic emerging and future industries led the charge

Two forces drove the divergence over the past year. On one side, global AI enthusiasm, the DeepSeek moment, and China's policy thread of support for high-tech, strategic emerging and future industries2 have lifted investor confidence in the related companies. On the other, macroeconomic headwinds continue to weigh on traditional industries, especially consumer sectors, keeping investors cautious. Using MSCI's Strategy Explorer, we measure companies' exposure to the strategic areas mentioned in China's 15th Five-Year Plan (15FYP).3 On average, A-share companies carry about twice the strategic-area exposure of the offshore market, and returns over the past year partly reflected these differences.4 Companies in the MSCI China A Onshore IMI Robotics and Autonomous Technology & Industrial Innovation Indexes, for example, returned more than those in the Millennials and Ageing Society Indexes. The information technology (IT)5 sector, with strategic exposure of half (58%) and about 38% of index weight, alone contributed 22% within MSCI China A's strategic exposure of 38%, which is over half. That positioning partly underpinned its return, the strongest of any A-share sector over the past year.
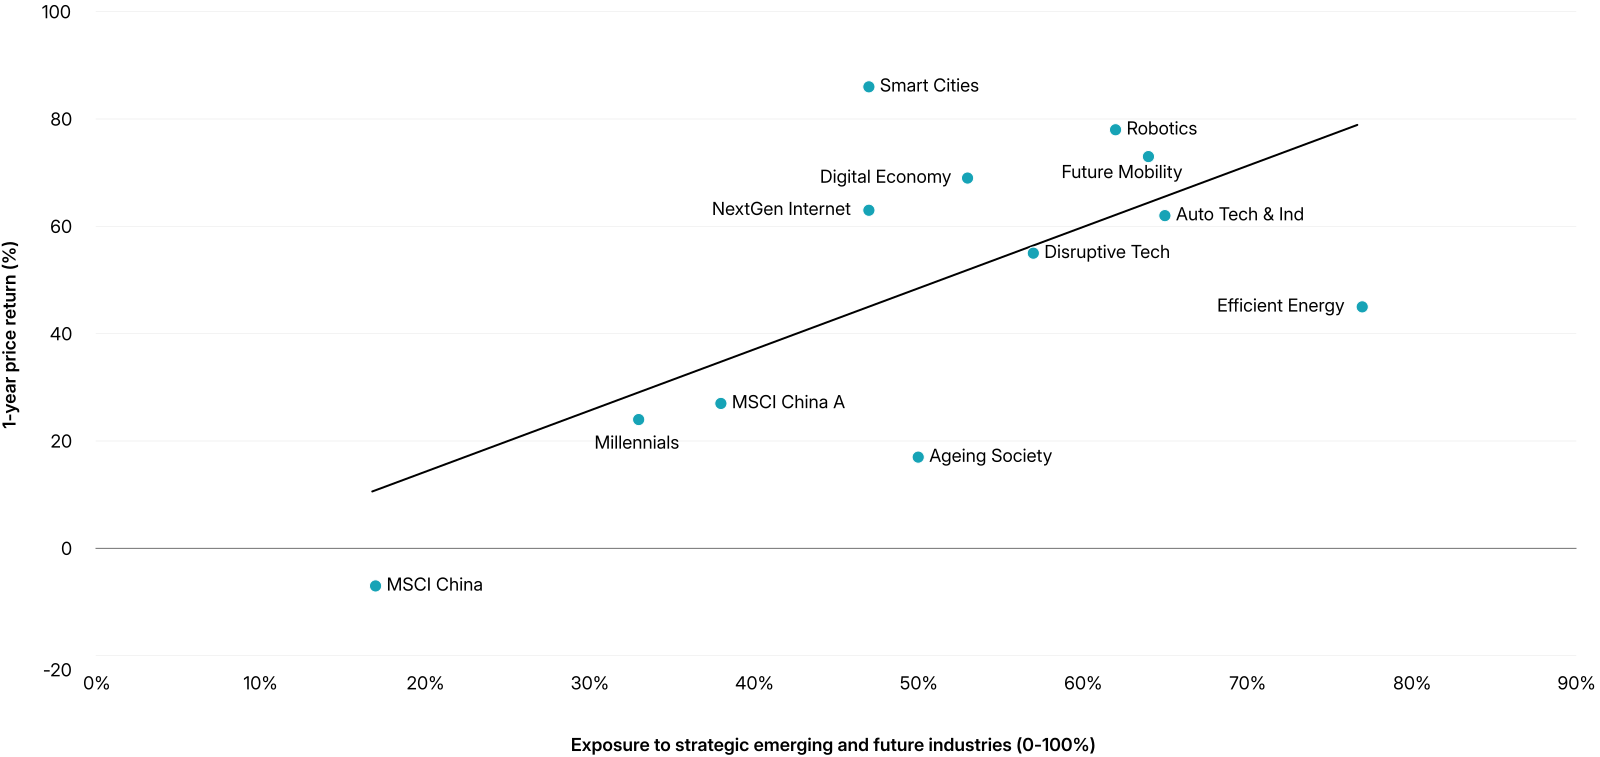
Recent returns reflect differences in strategic exposure
Price return of MSCI China, MSCI China A, MSCI China A Onshore IMI thematic indexes in local currency, from July 2025 to June 2026, and their average exposures to strategic emerging and future industries as of June 30, 2026. Strategic exposure is a 0–100% score for how much of a company's business ties to the 15FYP strategic-emerging and future industries (the sub-themes in the footnote), aggregated to the index by weight.
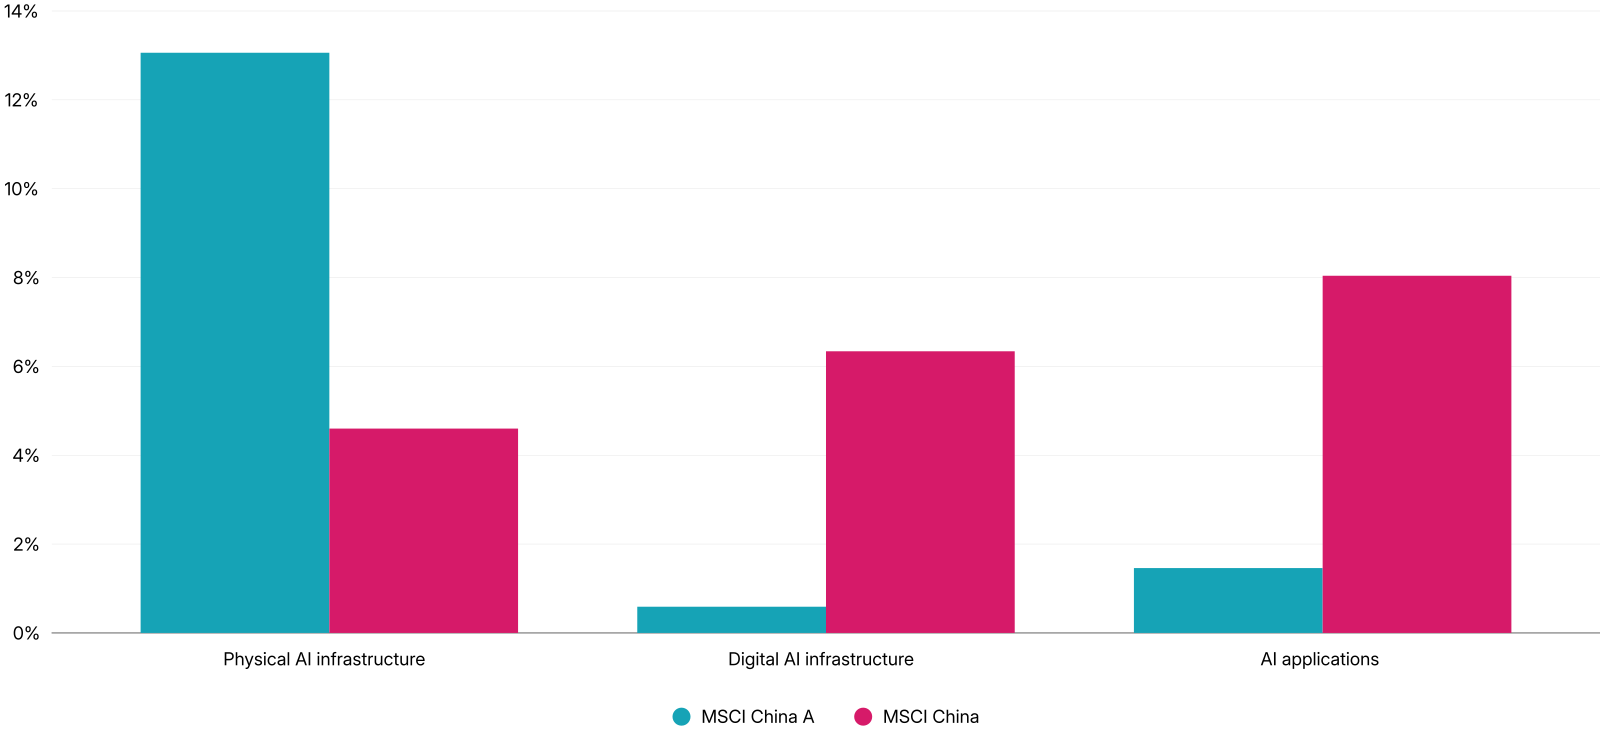
A second lens through MSCI's AI Value Chain data offers a complementary view of how the two market segments map to the global AI theme.6 Overall exposure is near parity (14% onshore versus 12% offshore), but the two segments show distinctly different layer exposures: the A-share market carries more exposure to physical AI infrastructure, such as data centers and semiconductors, while offshore China companies span a greater number of layers, sitting more in digital infrastructure and applications from cloud and foundation models to software, though that exposure is concentrated in a few large internet platforms.
Onshore and offshore markets show different exposures to the AI value chain layers
AI value chain exposure by layer as of May 29, 2026.
Fundamentals supported the structural move
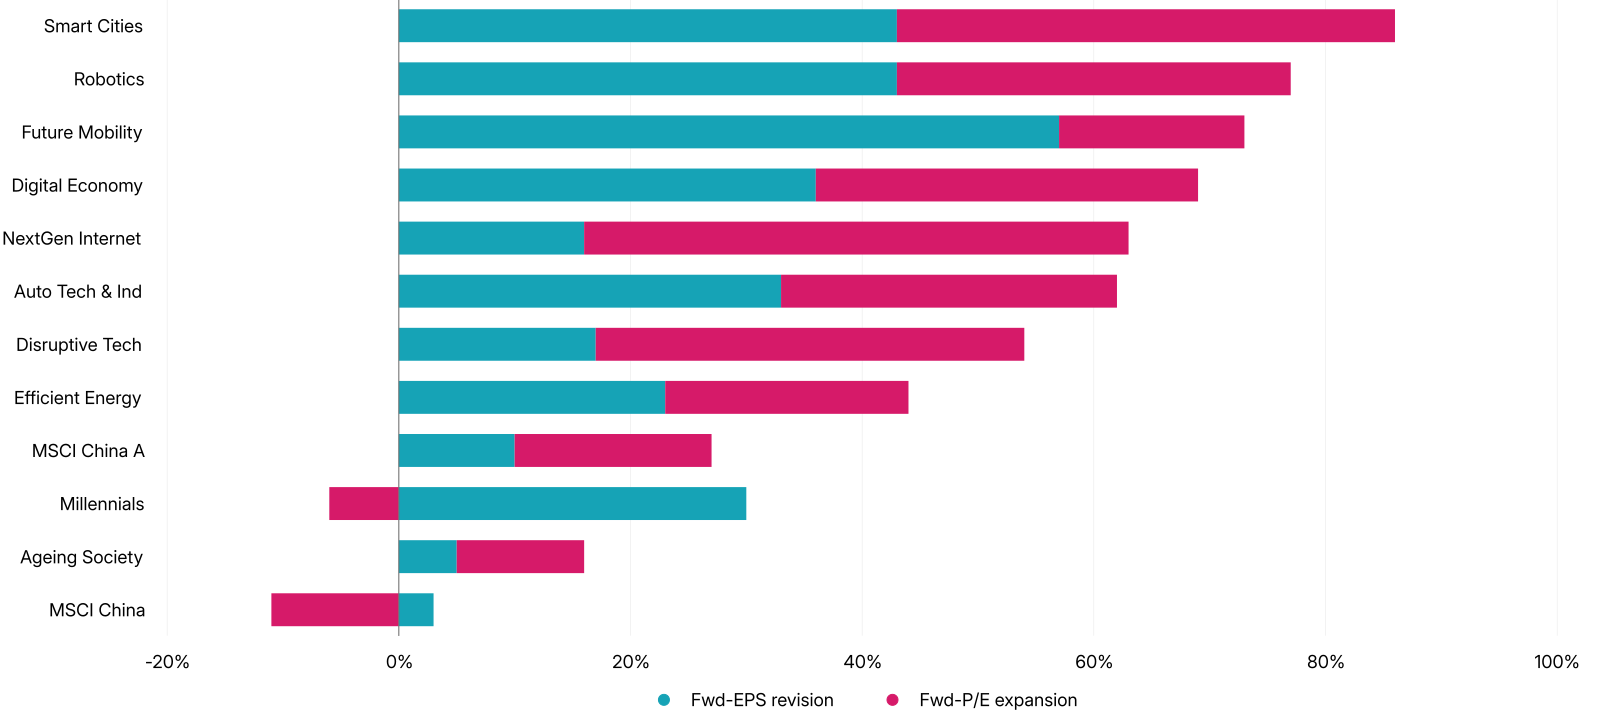
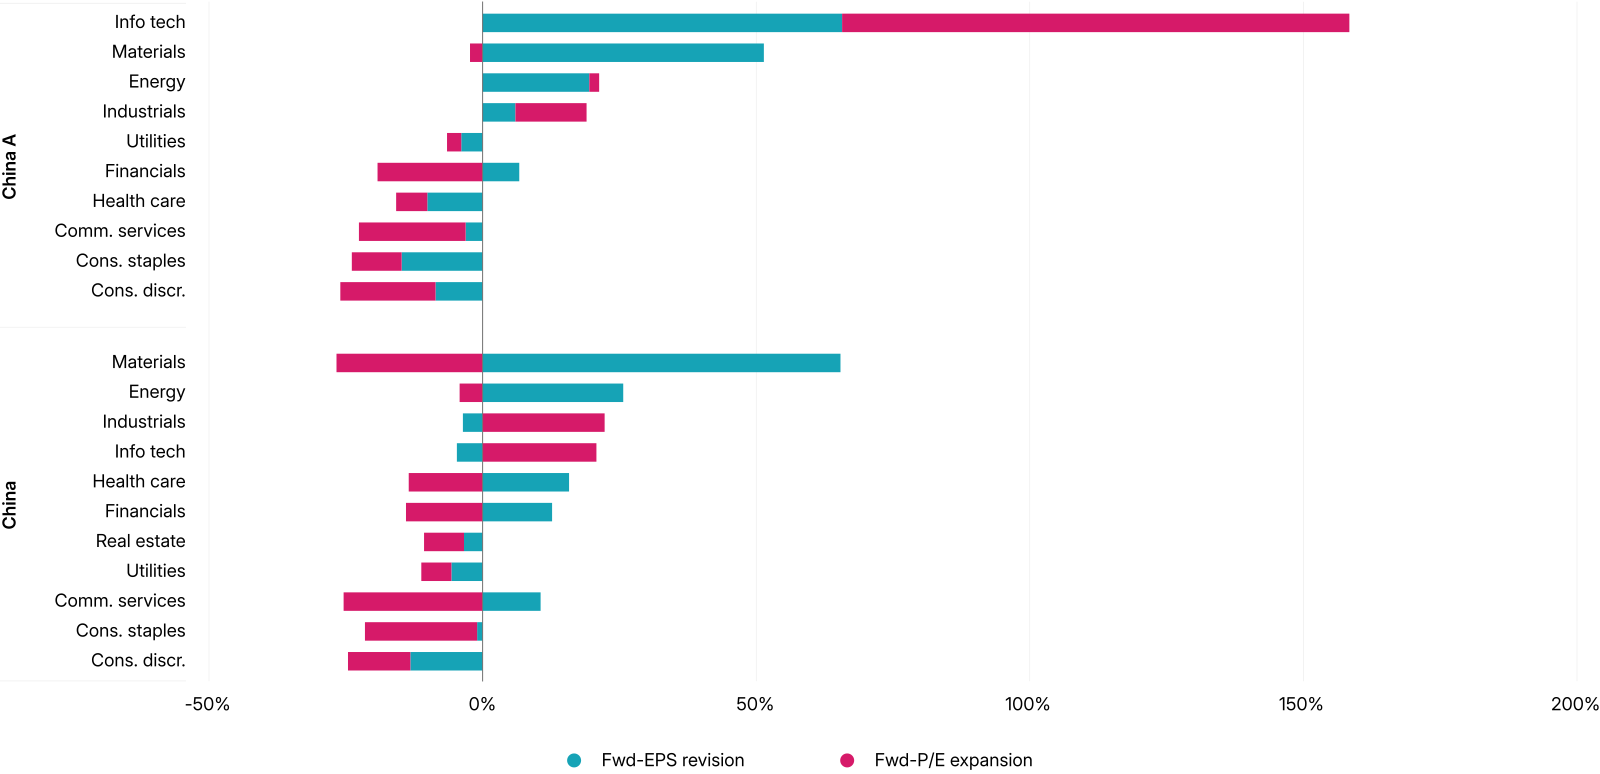
Fundamentals, not just sentiment, supported the outperforming segments this round. Outperforming themes such as smart cities, robotics, future mobility and digital economy saw notable improvements in growth prospects, which drove half or more of their returns over the past year. The offshore market, by contrast, saw its valuations contract, with little improvement in fundamentals to offset the decline.At the sector level, the valuation expansion was concentrated in A-share IT, though that sector's fundamentals also improved markedly. A few others, such as materials and energy, saw improving fundamentals too, but with little accompanying valuation expansion. This sector-level divergence and decoupling of fundamentals and valuations for some sectors reinforces the structural nature of the rally.
EPS revisions supported the outperformance of the leading segments
Panel A: return breakdown by theme
Index price return breakdown by changes in forward PE ratio and EPS revision from July 2025 to June 2026, for MSCI China, MSCI China A, and MSCI China A Onshore IMI thematic indexes.
Panel B: return breakdown by industry
Index price return breakdown by changes in forward PE ratio and EPS revision from July 2025 to June 2026, for MSCI China and China A sector indexes.
Structural divergence requires more selective conviction

That pattern changes how China exposure is best analyzed. When past divergences ran mainly through the listing channel, the onshore-versus-offshore allocation was most of the story. This time, industry composition and firm-level fundamentals played a significant role. The onshore market's outsized exposure to strategic industries and advanced technologies, such as AI, robotics and new energy, was the largest contributor. Selective conviction on the right exposures matters more for investors seeking to capture the opportunities tied to the country’s new growth drivers. 

Subscribe today
to have insights delivered to your inbox.

Strategy Explorer

Transform investment ideas into thematic strategies using AI-driven exposure modeling, allowing users to build, test and refine them within a single workflow.

Foundations of Dedicated China Allocations: Part 4

Although Chinese equities generally performed poorly from 2021 through 2023, certain dedicated China funds earned double-digit annualized returns. We propose a three-layer framework to help demystify the drivers of excess returns in the China market.

Are You Really Capturing the Right Factors? Unlocking Deeper Insights in China A-Share Factor Investing

China’s A-share market offers distinct factor premia. Our research shows how tailored, multi-factor strategies can capture these insights and build stronger, more resilient portfolios.

1 Chinese tech start-up DeepSeek's January 2025 release of its R1 model triggered a re-rating of Chinese tech equities and renewed global investor interest in China.2 "Strategic emerging industries" and "future industries" are policy designations set out in China's 15th Five-Year Plan (2026–2030). It identifies strategic emerging industries such as new-generation information technology, new energy, new materials, intelligent connected new-energy vehicles, robotics, biomedicine, high-end equipment and aviation and aerospace, together with forward-looking "future industries" including quantum technology, biomanufacturing, hydrogen and fusion energy, brain-computer interfaces, embodied intelligence and 6G communications. The 15FYP is not the first document to highlight these areas; many had already appeared across earlier government plans and policy documents in the years before its formal publication.3 Sub-themes we used to define the strategic area exposure in this analysis include semiconductors and integrated circuits, artificial intelligence and computing power, embodied AI and advanced robotics, intelligent connected new energy vehicles, new energy and energy storage, advanced materials, biomanufacturing and biomedicine, aerospace and the low-altitude economy, high-end equipment and industrial automation and future industries such as quantum technology and 6G.4 Strategic-area exposure is a score between 0 and 100%. Index-level exposure is the weighted sum of individual companies' exposures, using each company's index weight.5 GICS® is the global industry classification standard jointly developed by MSCI Inc. and S&P Global Market Intelligence. GICS is a registered trademark of MSCI and S&P Global Market Intelligence.6 MSCI's AI Value Chain data scores each company's exposure to the global AI value chain. As with strategic-area exposure, index-level exposure is the weighted sum of individual companies' exposures, using each company's index weight.

The content of this page is for informational purposes only and is intended for institutional professionals with the analytical resources and tools necessary to interpret any performance information. Nothing herein is intended to recommend any product, tool or service. For all references to laws, rules or regulations, please note that the information is provided “as is” and does not constitute legal advice or any binding interpretation. Any approach to comply with regulatory or policy initiatives should be discussed with your own legal counsel and/or the relevant competent authority, as needed.