Tariffs Raise the Specter of Stagflation: Three Macro Scenarios

Blog post
6 min read
April 22, 2025
Key findings
  • We provide multi-asset-class investors with a framework to assess the portfolio impacts of three macroeconomic scenarios — including stagflation and recession — that could arise from escalating trade tensions.
  • Stagflation is especially concerning, because the Federal Reserve would have limited ability to stimulate growth by lowering rates. In such scenarios, bonds and equities tend to decline simultaneously.
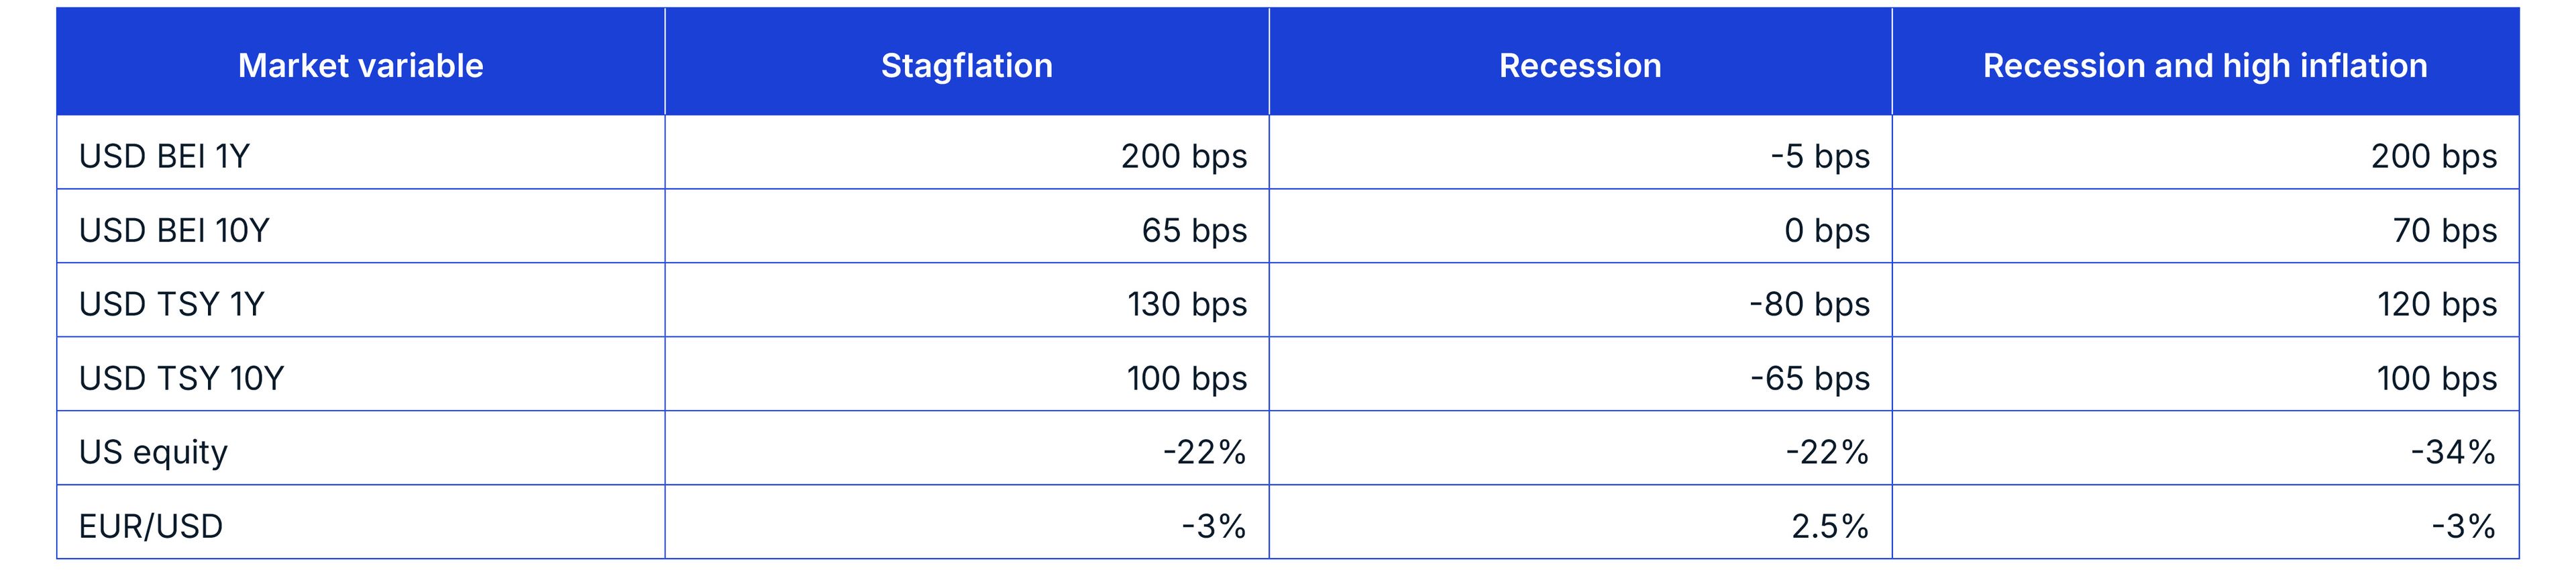
  • In our most adverse scenario — a recession combined with rising inflation — the U.S. equity market could decline by nearly 35% from levels prior to the tariff announcement.
Economists have cut growth forecasts and raised inflation expectations since the U.S. tariff announcement on April 2.[1] For multi-asset-class investors, the key question is how shifting macroeconomic expectations could affect asset prices — and how that effect compares to the recent sell-off. Under our worst-case scenario of an inflationary recession — a sharp economic contraction coupled with surging inflation — equity-market losses from before the April 2 tariffs announcement could amount to nearly 35%. The decline for a diversified portfolio of global equities, U.S. bonds and real estate — measured from that same date — could reach 19%.
Three forward-looking macroeconomic scenarios
We define three macroeconomic scenarios relative to the start-of-year baseline of robust U.S. growth and declining inflation:[2]
  • In the stagflation scenario, economic growth falls to 0% while inflation rises by 200 basis points, amid supply shocks and trade fragmentation. To combat high inflation, the central bank raises rates, which weighs on growth longer term.
  • The recession scenario assumes an economic contraction of 3%, while slowing demand reduces inflationary pressures. The Federal Reserve has room to cut interest rates, and growth recovers faster than in the stagflation scenario.
  • Our worst-case scenario combines a recession and high inflation. Despite a sharp economic contraction, persistent trade disruptions sustain inflationary pressures and push interest rates up, like the oil-price shocks during the stagflation of the 1970s, when recessions coincided with high inflation.[3]
Growth and inflation under our scenarios
The chart shows growth and inflation under the three macro scenarios, along with a baseline. It shows that, in the 4th quarter of 2025, under recession and high inflation, GDP growth turns negative, to about -3%, and inflation spikes to roughly 4.5%.
GDP and inflation paths were generated with the MSCI Macro-Finance Analyzer using the MSCI baseline scenario as of Dec. 31, 2024.
The charts below compare the scenarios' market impact to recent market performance. Despite the recent sell-off, equity markets may face significant further losses — particularly in our worst-case scenario — while government bonds may decline in our scenarios with inflationary pressures. The macro scenarios capture repricing based on shifting macroeconomic expectations, but do not account for the currently elevated U.S. equity-market valuation relative to history. A valuation-driven drawdown could further amplify equity losses.
Room for further losses under our macro scenarios
The chart shows how equities could sell off further in the in the coming weeks in all three scenarios, while U.S.-government bonds could rally in the recession scenario but fall in value if stagflation or recession and and high inflation occur.
Realized performance in USD between Jan. 1 and April 21, 2025, based on the MSCI USA Index and MSCI USD Government Bond Index.
Impact on multi-asset-class portfolios
To assess the scenarios' impact on multi-asset-class portfolios, we used MSCI's predictive stress-testing framework and applied the shocks from the table below to a hypothetical global diversified portfolio, consisting of global equities, U.S. bonds and real estate.[4]
Broad US market shocks under our scenarios
The table shows the broad market shocks under the three scenarios. Under recession and high inflation, one-year breakeven inflation spikes to 200 basis points, stocks sell off by 34% and the 10-year Treasury goes up by 100 basis points.
Assumptions about risk-factor shocks are informed by the MSCI Macro-Finance Analyzer. Breakeven inflation (BEI) is measured in basis points (bps).
The portfolio lost 19% in our worst-case "recession and high inflation" scenario, as growth shocks weigh on equities while increasing interest rates hurt bonds, typical for a stagflation environment, as discussed in our previous blog post. The stagflation scenario resulted in a similar, but milder loss of 13%. By contrast, in the recession scenario, rallying bonds offset equities, reducing the portfolio's loss to 9%. This underscores that bonds can help limit losses during recessions — but only when inflationary pressures are absent.
Changes to portfolio values under our scenarios
Loading chart...
Please wait.
This interactive chart allows you to select currency and asset types for a series of portfolios and then see the impacts of the various scenarios. Under stagflation, a USD multi-asset-class portfolio loses roughly 20% in its U.S.-equity sleeve, roughly 18% in its global-equity sleeve and roughly 7% in its U.S. government bonds. Portfolio impact as of April 15, 2025. Source: S&P Global Market Intelligence, MSCI
Is there any upside?
Our adverse scenarios are framed relative to the baseline macro scenario at the start of the year, which featured robust growth and declining inflation. In contrast, an optimistic scenario may assume a return to the baseline macroeconomic outlook. The chart below shows the potential impact of a reversal from April 15 to the Feb. 19 market peak. We compare this with the additional losses that could occur under our macroeconomic scenarios, accounting for market movements during the same period.[5]
What a market reversal could mean — and the room for further losses
The chart shows potential losses and gains under the three scenarios, but also under a market reversal. Under recession and high inflation, U.S. equities could lose about 20%, but gain about 15% in a market reversal.
Profits and losses for the reversal reflect the inverse of returns between Feb. 19 and April 21, 2025. For the other scenarios, we present the P&L under our macro scenarios, adjusted for changes already priced during that same period.
We illustrated a framework to help investors understand how shifting macroeconomic expectations could affect portfolios. In particular, the combination of declining growth with surging inflation — at a time when there may not be a "Powell put" — could hurt multi-asset-class portfolios. The authors thank Will Baker and Leo Fischler for their contributions to this blog post.

Subscribe today
to have insights delivered to your inbox.

How Tariffs Could Impact Equity Markets: Building Scenarios

Still a Long Way Down for US Equities?

Managing Long-Term Portfolios Through Short-Term Volatility

1 Matthew Boesler, “Economists Slash US Growth, Boost Inflation Forecasts on Tariffs,” Bloomberg, April 4, 2024.2 These scenarios are not forecasts but hypothetical scenarios. We used the MSCI Macro-Finance Model to translate macroeconomic assumptions to U.S. market impact. You can find the scenarios here: stagflation, recession and recession with high inflation.3 Bill Dudley, “Stagflation Is Now America's Best-Case Scenario,” Bloomberg, April 7, 2025.4 The results are generated by using model correlations to propagate shocks to the portfolios, using MSCI's BarraOne®. MSCI clients can download the correlated BarraOne stress test and RiskMetrics® RiskManager® stress test. Treasury inflation-protected securities (TIPS) are represented by the iBoxx TIPS Inflation-Linked Index provided by S&P Dow Jones Indices. U.S. Treasurys, equities and corporate bonds are represented by MSCI indexes. Private equity is represented by model portfolios. U.S. real estate is represented by the MSCI/PREA U.S. AFOE Quarterly Property Fund Index. The composite portfolio is 50% global equities (35% public and 15% private), 10% U.S. Treasurys, 10% TIPS, 10% U.S. investment-grade bonds, 10% U.S. high-yield bonds and 10% U.S. real estate.5 A reversal scenario — reflecting up-to-date market data — can be implemented by using the by-date stress-testing functionality as described on the support site's pages: BarraOne stress test and RiskMetrics® RiskManager® stress test.

The content of this page is for informational purposes only and is intended for institutional professionals with the analytical resources and tools necessary to interpret any performance information. Nothing herein is intended to recommend any product, tool or service. For all references to laws, rules or regulations, please note that the information is provided “as is” and does not constitute legal advice or any binding interpretation. Any approach to comply with regulatory or policy initiatives should be discussed with your own legal counsel and/or the relevant competent authority, as needed.