The Climbing Costs to Insure US Commercial Real Estate
Key findings
- Insurance costs as a share of income receivable for properties in the MSCI U.S. Quarterly Property Index have more than doubled in the last five years.
- Costs have been highest in Florida and California due to a range of prominent risk factors.
- Climate change could drive further insurance cost increases through more frequent and intense extreme weather events.
Ever since the Federal Reserve embarked on its current tightening cycle, rising borrowing costs have dominated discussions in commercial real estate. But interest rates are not the only rates that investors have been keeping an eye on: insurance rates have been steadily increasing in recent years, leading to higher operating expenses and putting downward pressure on net operating income.
Data from the MSCI U.S. Quarterly Property Index shows that insurance costs as a percentage of income receivable more than doubled to 2.3% from 1.0% over the five years between September 2018 and September 2023. These increasing costs have been attributed to the growing number, and increased severity, of extreme weather events, and higher reinsurance rates.[1]
Insurance costs have increased as a share of income receivable
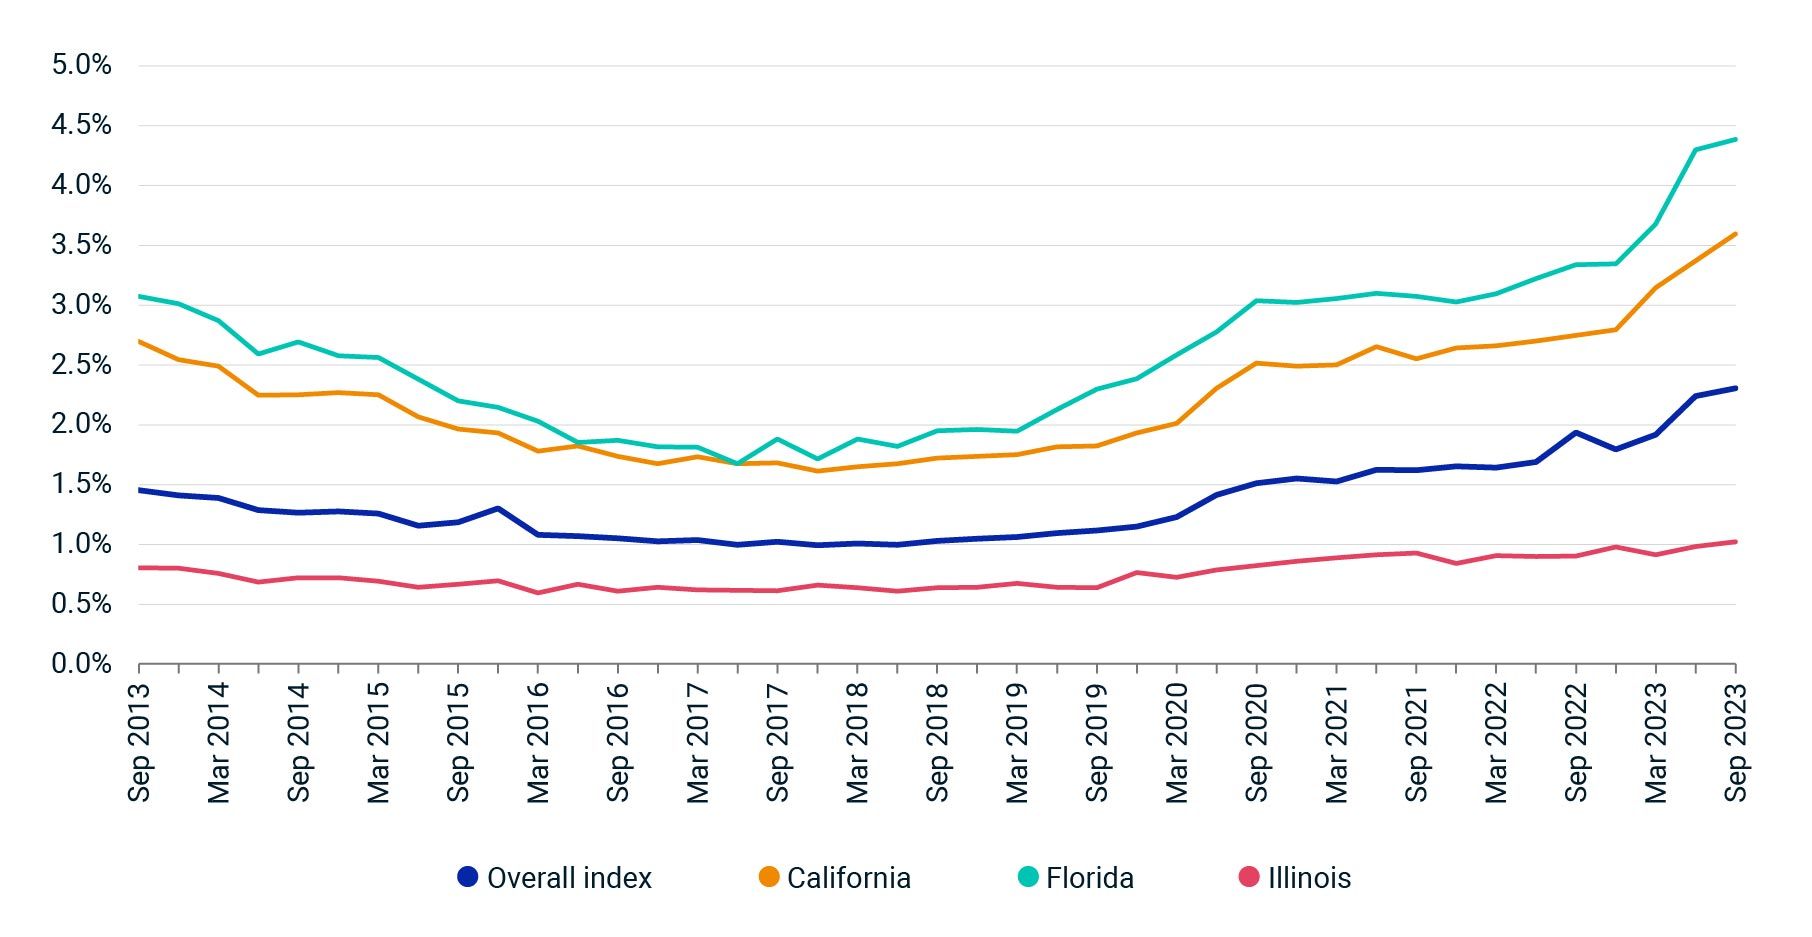
Source: MSCI U.S. Quarterly Property Index
Looking at data for Q3 2023 and breaking down the results by state reveals a wide range of outcomes. Florida and California registered the highest insurance costs as a percentage of income receivable at 4.4% and 3.6%, respectively. Illinois had the lowest insurance costs, which accounted for 1.0% of income receivable.
Costs are highest in Florida and California
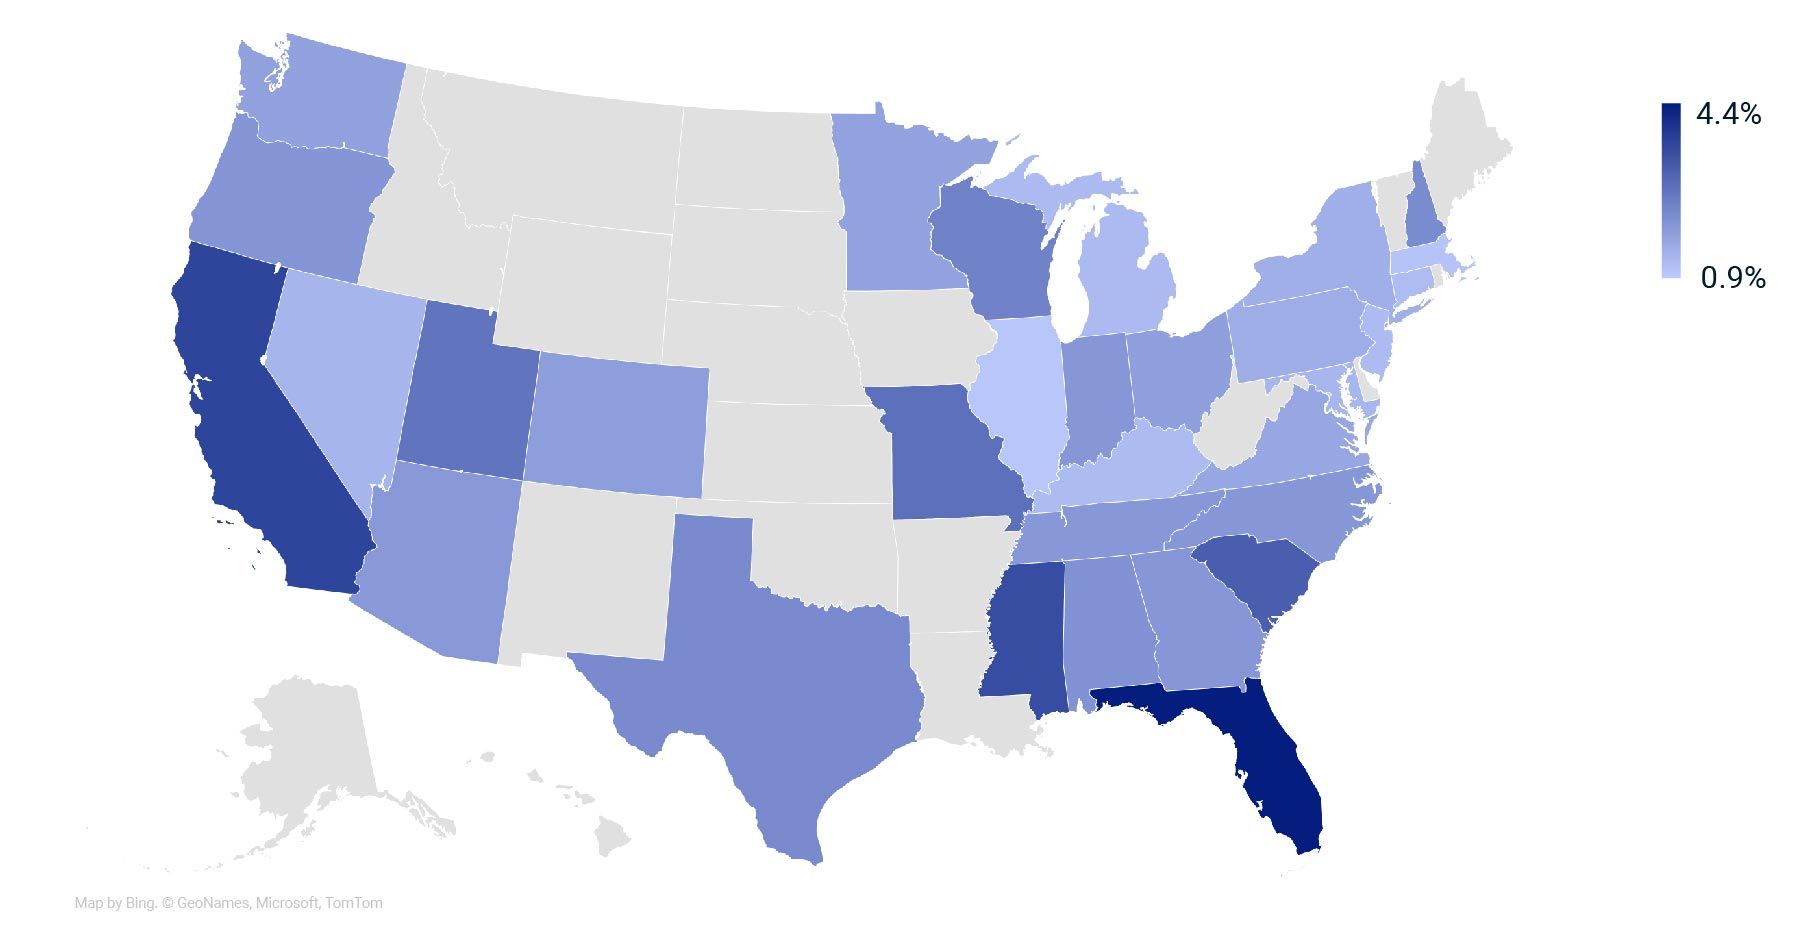
Source: MSCI U.S. Quarterly Property Index. Insurance costs as a percentage of income receivable at Q3 2023. Data shown for states where there are enough properties to meet confidentiality criteria. Grey states indicate no/insufficient data.
Some of the regional variation may be due to dissimilar regulatory and insurance-market conditions in each state, and to differences in property-type allocations, but the bulk of the variation is likely attributable to diverse risk profiles. For example, the fact that insurance costs were highest in Florida and California will probably not come as a surprise to many, given the prominent risks faced by properties in these states. For Florida these include hurricanes, floods, sinkholes and tornados, while in California, wildfires and earthquakes are high-profile risks.
If the frequency and severity of extreme weather events increase, investors could face further premium increases. An analysis of the properties in the quarterly index using MSCI's physical Climate Value-at-Risk (VaR) model may help to reveal where insurance cost pressures tied to climate change could be highest. At the overall level, under a 3 degrees C-warming scenario, our model estimates that 3.1% of the value in the index could be at risk. It is again probably not a surprise that Florida and California record an above-average VaR estimate, but states like New Jersey and Massachusetts also score above average in the model.
The consequences of higher insurance costs may not be as dramatic as the impact that tighter monetary policy has had on commercial real estate but are nevertheless reshaping the calculus for investors.

Subscribe todayto have insights delivered to your inbox.
1 Konrad Putzier, “Surging Insurance Costs Have Come for Office Landlords,” Wall Street Journal, Sept. 25, 2023.
The content of this page is for informational purposes only and is intended for institutional professionals with the analytical resources and tools necessary to interpret any performance information. Nothing herein is intended to recommend any product, tool or service. For all references to laws, rules or regulations, please note that the information is provided “as is” and does not constitute legal advice or any binding interpretation. Any approach to comply with regulatory or policy initiatives should be discussed with your own legal counsel and/or the relevant competent authority, as needed.