The Futures of Singapore’s Equity Market
Key findings
- The Singapore equity market has underperformed the developed markets over the long term and currently trades at a valuation discount relative to developed markets.
- After the June 2021 rebalance and inclusion of foreign listings, the MSCI Singapore Free Index was more diversified across sectors and geographic revenues with higher exposures to growth and transformative technologies.
- Futures linked to the MSCI Singapore Free Index have been considered by some institutional investors to manage Singapore equity exposure.
As investors grapple with the investment implications of geopolitics, deglobalization and diverging regulation, country allocations have reemerged as a critical consideration in portfolio construction. One national market that has experienced recent change, which could impact investment-allocation decisions, is the Singapore equity market.
We compared key characteristics of the Singapore equity market with other developed markets and analyzed the impact of including foreign-listed securities in the MSCI Singapore Free Index (SiMSCI) since June 2021.[1] We also look at the notional volume of futures linked to SiMSCI over the last five years, one option available to investors for managing their Singapore equity exposure.
The value-growth rotation has influenced SiMSCI's performance
From January 2002 through September 2023, SiMSCI underperformed the MSCI World Index, 6.9% versus 7.5%, respectively.[2] Over the first half of the period, however, the index outperformed the global equity market, largely due to an overweight in value-oriented financial-services stocks. After 2012, as growth-oriented U.S. technology stocks soared, SiMSCI had an active underweight to the IT sector and underperformed. In 2022, higher dividend yields, inflation and rising interest rates motivated investors to shift focus from growth to value in the wake of the COVID-19 pandemic. In response, SiMSCI's value bias helped it outperform broader developed markets.
SiMSCI's value bias has influenced its performance
The benchmark is the MSCI World Index.
For most of the 10 years ending September 2023, SiMSCI traded at a valuation discount based on the forward price-to-earnings ratio (P/E) and offered higher dividend yields relative to other developed markets. Singapore stocks in the MSCI World High Dividend Yield and MSCI AC Asia Pacific High Dividend Yield Indexes have consistently been overweight relative to their weights in the corresponding market-cap indexes.[3] The index has also historically provided lower correlation relative to developed markets. From January 2002 through September 2023, SiMSCI has had a 50% correlation with the MSCI World Index, making a case for potential diversification benefits.
SiMSCI's high valuation discount and dividend yield versus developed markets
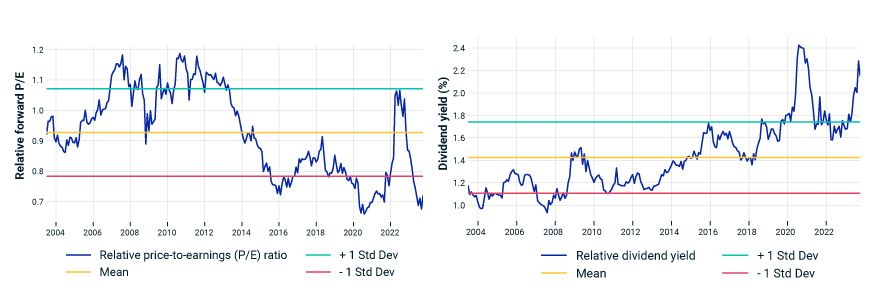
Analysis period is from June 30, 2003, to Sept. 30, 2023, and is defined by data availability. The benchmark is the MSCI World Index.
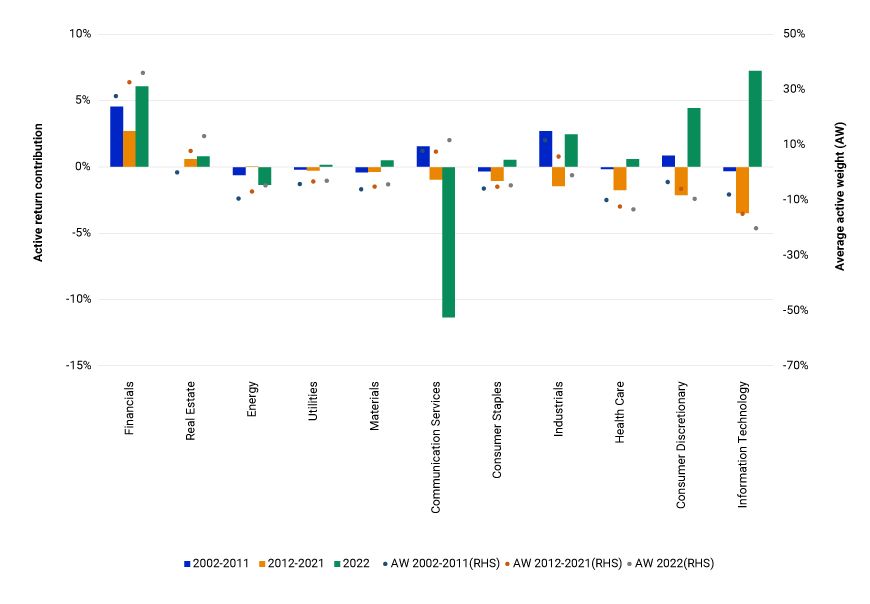
Including foreign listings has aided diversification
Since including foreign-listed stocks, the composition of the MSCI Singapore Indexes has become more diversified.[4] The Global Industry Classification Standard (GICS®)[5] communication-services and industrials sectors' share in the index expanded, and the revenue contribution from the Pacific region fell in favor of a greater contribution from the emerging markets ex China.
Sector and economic exposures are now broader in SiMSCI
Loading chart...
Please wait.
Data as of Sept. 30, 2023.
To assess other changes related to the inclusion of two foreign listings, we compared SiMSCI with a simulated index of Singapore Free with foreign listings that includes the Sea ADR since its IPO in 2017[6] and Grab since March 2022, its index inclusion date, and a simulated Singapore Free ex-foreign-listings index, which excludes the foreign-listed stocks added since June 2021.[7]
We found that after June 2021 SiMSCI exhibited positive active exposures to growth and volatility and negative active exposure to value relative to the simulated Singapore Free ex-foreign-listings index.
Foreign listings altered factor exposures
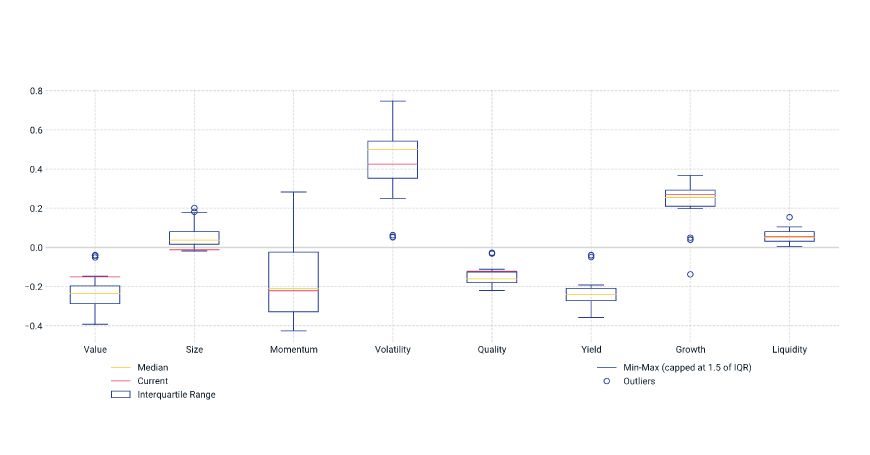
Analysis period is from May 31, 2021, to Sept. 30, 2023. The exhibit compares the MSCI Singapore Free Index (SiMSCI) with the simulated SiMSCI ex foreign listings as the benchmark.
And SiMSCI had higher exposure to the transformative-technologies theme compared to the simulated Singapore Free ex-foreign-listings index.
Exposure to transformative-technologies theme rose
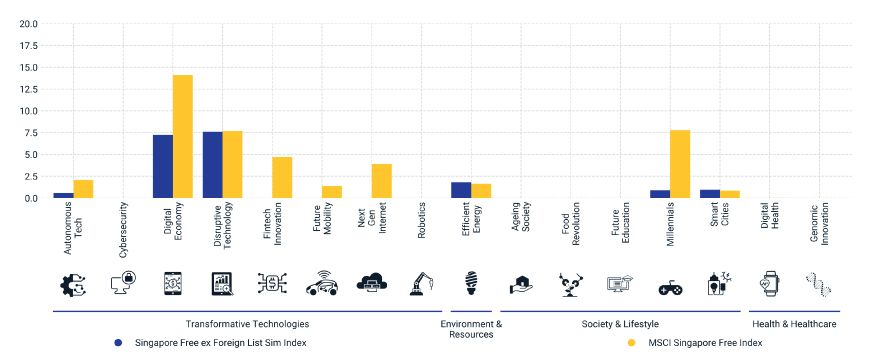
Data as of Sept. 30, 2023.
Exposure, or lack thereof, to growth stocks can help explain SiMSCI's performance in recent years. Starting in 2019, SiMSCI (yellow line below), because it had lower exposure to growth stocks, underperformed the simulated index with foreign listings (turquoise line). SiMSCI and the simulated index with foreign listings had similar performance after the Sea ADR and Grab were fully included in SiMSCI. However, since November 2021, SiMSCI underperformed the simulated index ex foreign listings (dark blue line) because of underperforming foreign-listed growth stocks.
Growth exposure from foreign listings has impacted performance
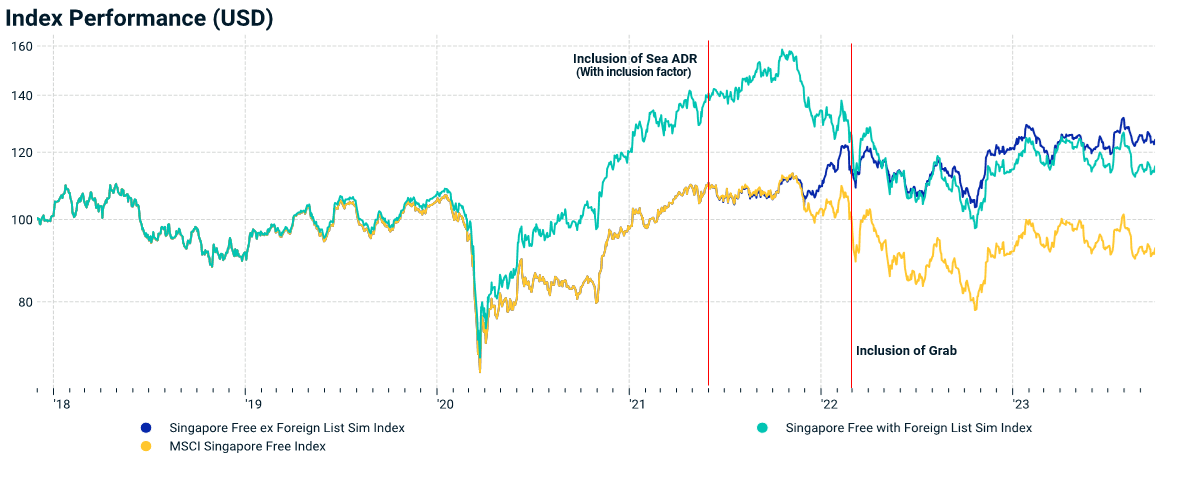
Analysis period is Nov. 30, 2017, to Sept. 30, 2023, beginning from the date of the Sea ADR IPO. The Sea ADR was first added to the MSCI Singapore Free Index after the May 2021 semiannual index review and June 2021 rebalance. An inclusion factor was used until the inclusion was fully implemented over the next two index reviews. The Grab was included in the simulated index ex foreign listings after the February 2022 index review and March 2022 rebalance.
SiMSCI's liquidity improved after the foreign listings were included. As of Sept. 30, 2023, the index had an annualized traded-value ratio (ATVR) of 98 compared to 63 for the simulated index ex foreign listings.[8]
Managing Singapore equity exposure
Institutional investors may seek to manage their Singapore equity exposure through a variety of instruments. One option is futures linked to SiMSCI, which can be used to express an asset-allocation decision, make a tactical adjustment or equitize cash. The notional volumes of these futures traded on various exchanges[9] had an uptick in the fourth quarter of 2020 and since then have remained at an average daily notional volume ranging from USD 1 to 1.4 billion.[10]
Changes in SiMSCI's composition could impact global equity allocations
The foreign listings added to the MSCI Singapore Free Index since June 2021 have diversified its composition, adding exposures to growth and transformative technology as well as to the communication-services sector and emerging markets ex China (via company revenues). Awareness of these changes may help investors assign country weights as part of tactical and strategic asset allocations in global equities.

Subscribe todayto have insights delivered to your inbox.
1 The MSCI Singapore Free Index was launched on April 30, 1993, and is designed to measure the performance of the large- and mid-cap segments of the Singapore equity market. The index has 22 constituents and covers approximately 85% of the free-float-adjusted market capitalization of the Singapore equity universe. In May 1999, the foreign-ownership restrictions in Singapore were lifted. Since that date, the MSCI Singapore Index and the MSCI Singapore Free Index, as well as the corresponding regional developed-market free and non-free indexes, have had the same constituent market capitalizations and performance.2 Returns are in gross USD.3 From January 2002 through September 2023. Total returns are in gross USD.4 Starting with the June 2021 MSCI semiannual index rebalance, foreign listings of Singapore companies became eligible for inclusion in the MSCI Singapore Indexes.5 GICS is the global industry classification standard jointly developed by MSCI and S&P Global Market Intelligence.6 Sea Limited (NYSE: SE) is an internet and mobile platform company, which engages in the provision of online gaming services.7 Grab Holdings Limited (NASDAQ:GRAB) operates as a superapp, offering ride-hailing, food delivery and digital payment solutions.8 ATVR is used to measure liquidity. MSCI uses ATVR as an investability criterion to determine the inclusion of securities into the MSCI indexes.9 Notional average daily volume is calculated using daily data over a month based on data from the SGX, EUREX and HKEX exchanges.10 Based on rolling 3-month average of monthly ADV notional.
The content of this page is for informational purposes only and is intended for institutional professionals with the analytical resources and tools necessary to interpret any performance information. Nothing herein is intended to recommend any product, tool or service. For all references to laws, rules or regulations, please note that the information is provided “as is” and does not constitute legal advice or any binding interpretation. Any approach to comply with regulatory or policy initiatives should be discussed with your own legal counsel and/or the relevant competent authority, as needed.