
The Hidden Cost of Misaligned Proxies in Index Replication
- Regional futures baskets tracking the MSCI ACWI Index showed tracking errors of 31 to 66 bps since 2008, rising above 100 bps during the GFC and COVID-19.
- Index replicators using regional futures may face looser proxies as average pairwise correlations across both countries and sectors fell by roughly 15 to 20 percentage points between 2016–2021 and 2021–2026.
- Regional baskets add tracking error, FX exposure and multi-exchange margin that a single USD-denominated ACWI contract avoids, though investors may also need to weigh liquidity, trading capacity and roll costs.
Mentioned in this blog post:
Pairwise correlations across major developed and emerging markets have fallen over the last five years compared to the 2016–2021 period. Average pairwise correlation among the Global Industry Classification Standard (GICS®) sectors in the MSCI ACWI Index fell from 0.76 to 0.57 across the two periods.1 Among the top six developed and emerging markets by weight, pairwise correlations fell from 0.66 to 0.51.2 Lower correlations mean a given mismatch between a basket's country exposures and those of a global benchmark translate into a larger tracking error than it would have had the markets moved closely together.
For investors seeking to replicate the return of global indexes, lower cross-market correlations may raise the tracking error of using combinations of misaligned regional and country futures as proxies, and market stress can widen that further. By misaligned proxies we mean futures on indexes whose constituents differ from the target index. The most heavily traded local futures are often based on indexes with constituents selected and weighted differently, so their sector and country weights, and the returns they drive, differ from those of the target index. Tracking error can also come from the choice of instrument, such as ETFs or futures, and from the approach and constraints used to select and weight them. We focus on the proxies themselves, using market-cap weights rebalanced quarterly.
The plot shows the pairwise correlations among the top six countries by country weight in the MSCI World Index and the MSCI Emerging Markets Index, and amongst GICS® sectors in the MSCI ACWI Index. Pairwise correlations are calculated using weekly gross returns. Time period: Oct. 2016 to Sept. 2021 (left heatmap) and Oct. 2021 to Sept. 2026 (right heatmap).
Replication using regional proxies adds three layers of complexity
Using misaligned proxies, which may differ from the target index in the number and weights of constituents, investors can introduce three sources of complexity:
- Basis risk, which may widen during periods of crisis;
- Foreign exchange (FX) exposure, since contracts may be denominated in local currencies and require additional currency forwards to align with the index; and
- Margin that investors must post separately when contracts are listed across different exchanges.
To measure the basis risk introduced by hedging with misaligned futures, we built three hedging baskets, each designed to track the returns of the MSCI ACWI Index from January 2008 to August 2026. The three differ in how they proxy developed-market exposure outside the U.S. Basket 1 uses a single EAFE proxy. Basket 2 replaces it with separate European, Japanese, Australian and Canadian proxies. Basket 3 breaks the European exposure down further into euro-area, U.K. and Swiss proxies. All three use the same U.S. proxy and the MSCI Emerging Markets Index.
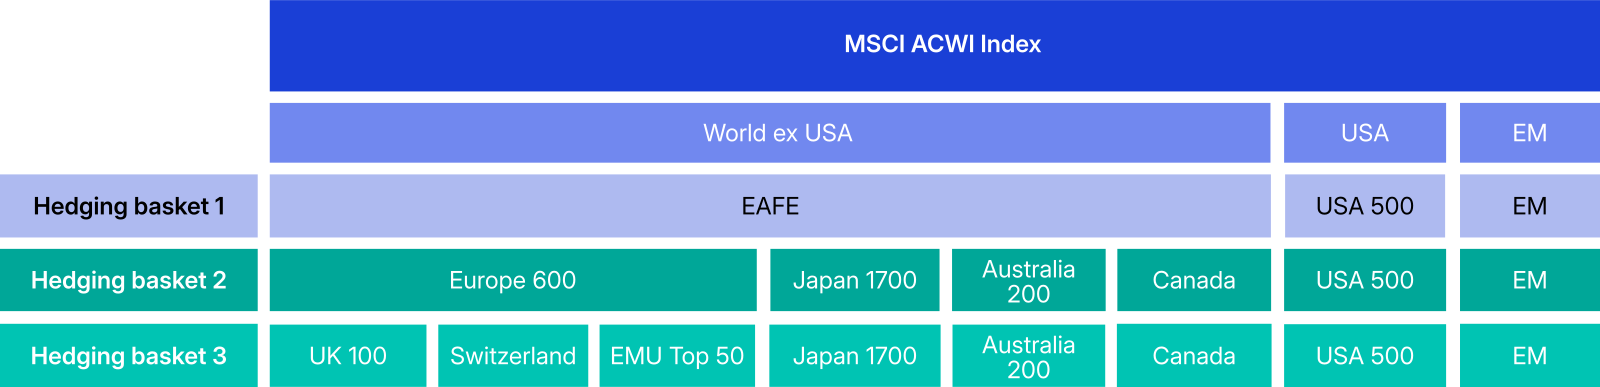
Indexes / simulations used as proxies for futures exposures in the three hypothetical hedging baskets. Baskets are constructed using market-cap weights and are rebalanced quarterly. The proxies reflect some investors' preference for local futures on indexes with a fixed number of constituents, rather than the building blocks of the MSCI ACWI Index. They cover the largest geographic exposures with a limited number of indexes. While there are many other possible constructs, we use these indexes for comparative purposes.
Total tracking error over the full period remained slightly modest, ranging from around 31 bps to 66 bps, depending on the basket and the granularity of contracts selected. The third basket had the highest tracking error, associated primarily with the decomposition of European exposure which leaves larger country weight gaps than a single regional proxy would. Currency and country risk were the two largest contributors across the three baskets.
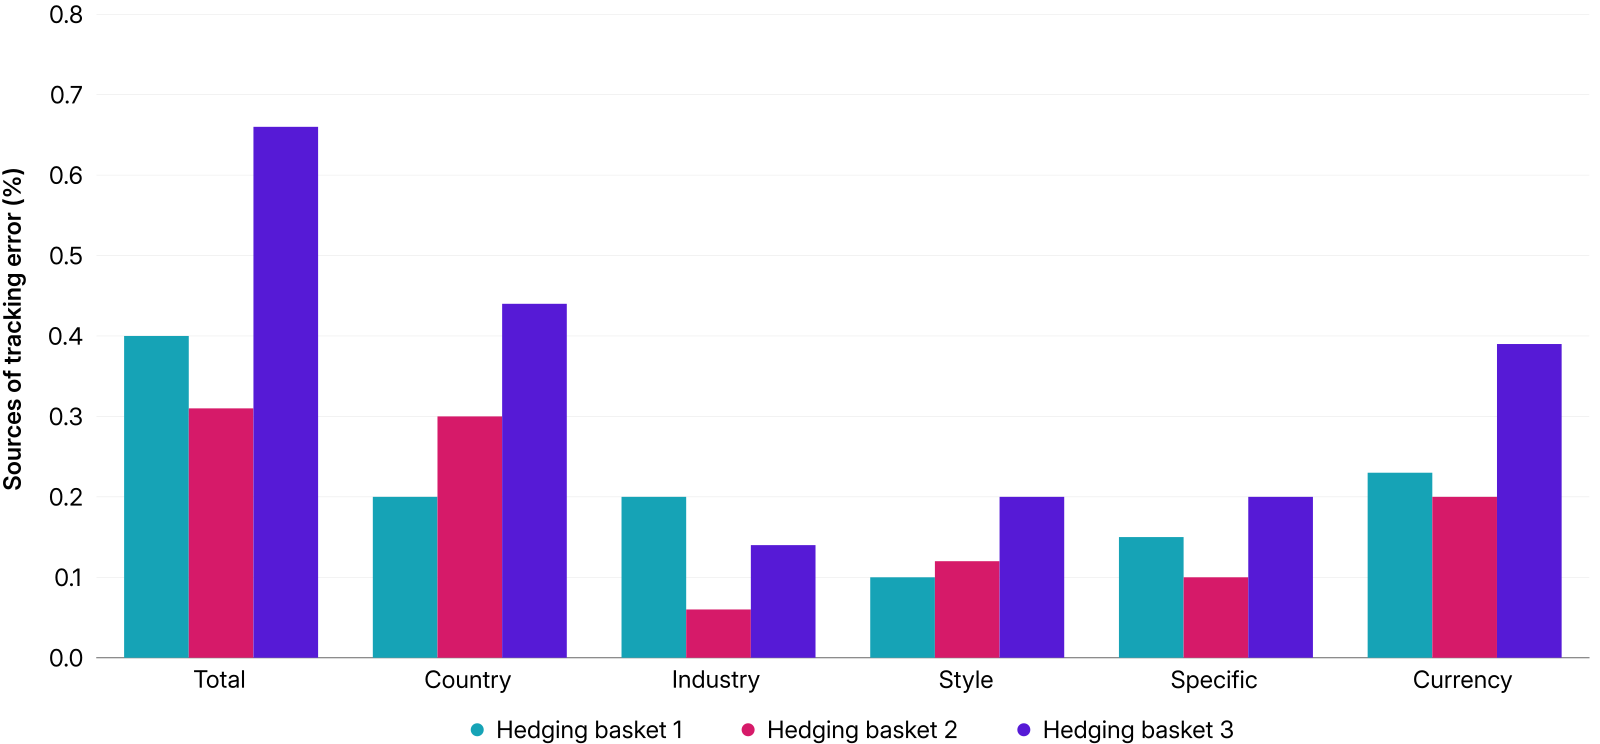
Sources of tracking error for the three hedging baskets against the MSCI ACWI Index. Time period: Jan. 31, 2008, to Sept. 30, 2026.
To better understand what drove the risk within each basket, we analyzed the proxies used to represent the MSCI building blocks of ACWI, such as USA 500 for the MSCI USA Index, or the MSCI Europe Index using Europe 600 or a combination of EMU Top 50, UK 100 and Switzerland.
Basket 1's tracking error came mainly from using the U.S. proxy in place of the MSCI USA Index and the MSCI EAFE Index in place of World ex USA. As a subset of ACWI, EAFE differs from World ex USA only in not covering Canada. In Basket 2, Japan and Australia stood out for relatively higher tracking error, which may reflect their underlying MSCI indexes' narrower constituent count relative to the broader proxies used. Basket 3's use of EMU Top 50, UK 100 and Switzerland in place of the MSCI Europe Index pushed the tracking error of the European proxy block against Europe above 150 bps, stemming from country, style, currency and stock-specific risk.
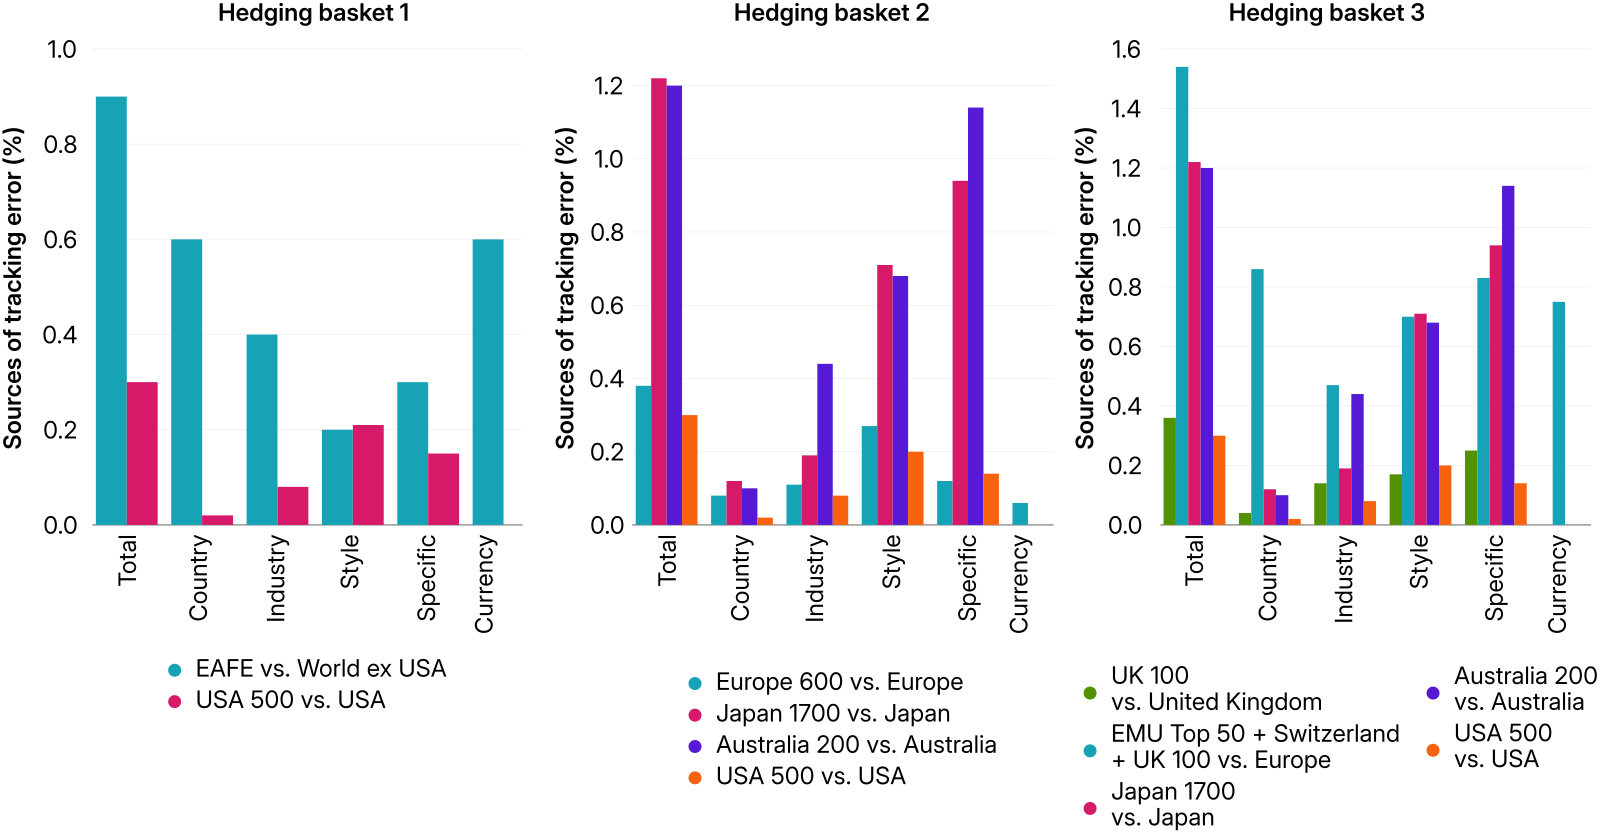
Tracking error decomposition for the hedging baskets. Time period: Jan. 31, 2008, to Sept. 30, 2026.
Tracking error generally rose in periods of elevated market volatility
Tracking error can depend on multiple factors, such as the size of the weight mismatch, the volatility of the underlying markets and how closely those markets move together. All else equal, lower correlations across markets raise the tracking error of a basket with fixed weight differences from its benchmark.3 Tracking error typically was modest, but widened to over 100 bps across all three baskets during periods of market crisis such as the Global Financial Crisis (GFC) and COVID-19, broadly coinciding with spikes in the MSCI ACWI Index's realized volatility.
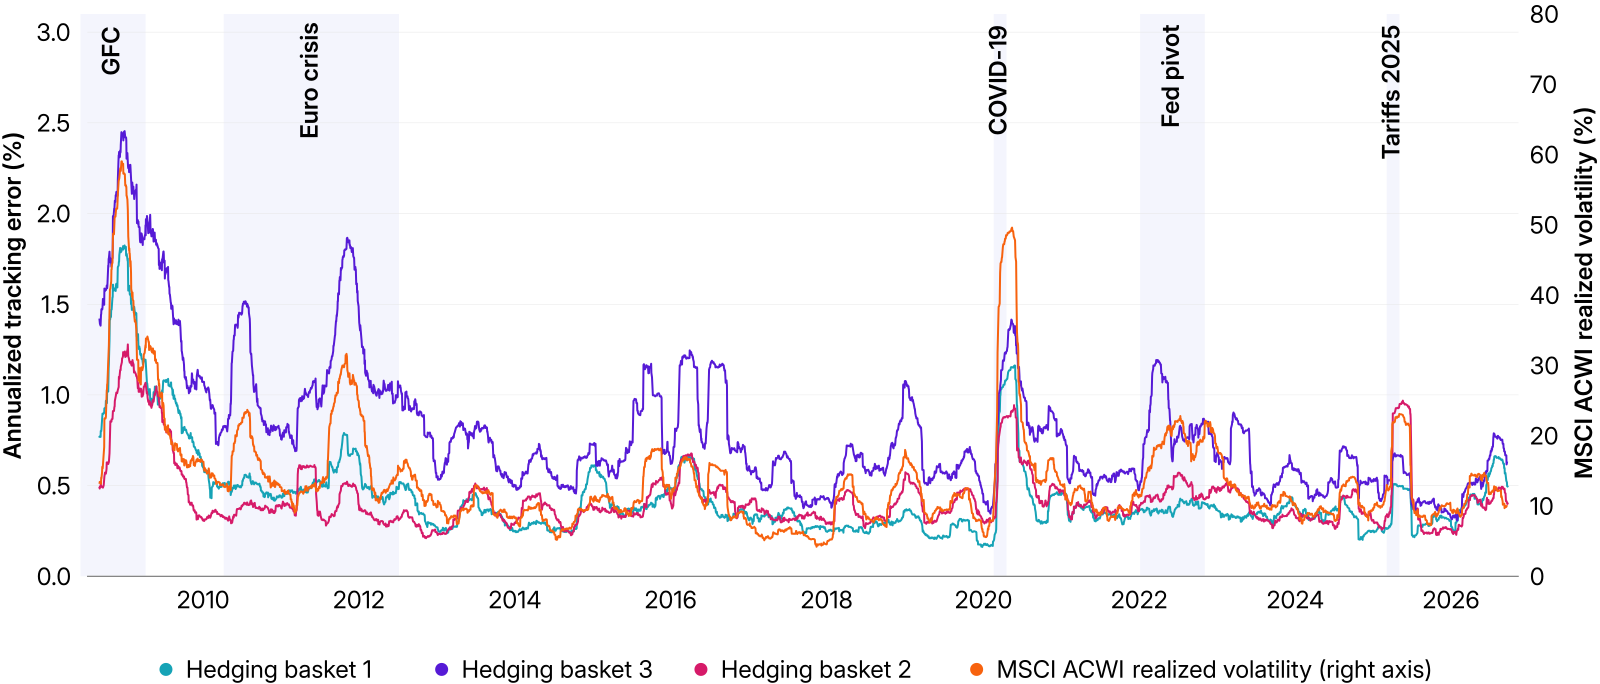
Time period: Jan. 31, 2008, to Sept. 30, 2026. We calculate one-month rolling tracking error using daily returns of the respective baskets versus the MSCI ACWI Index. On the secondary y-axis we plot the 30-day realized volatility of the MSCI ACWI Index. Crisis windows are GFC (Oct. 9, 2007, to March 9, 2009), Euro Crisis (April 1, 2010, to June 30, 2012), COVID-19 (Feb. 19, 2020, to March 23, 2020), Fed Pivot (Dec. 27, 2021, to Oct. 12, 2022) and Tariffs 2025 (Feb. 19, 2025, to April 8, 2025).
Managing currency exposure added complexity
Tracking error based on index/simulation proxies is only one part of the potential mismatch. The MSCI ACWI Index is calculated in USD, with currency movements reflected in index returns and non-USD exposure roughly one-third of the index as of Sept. 30, 2026. A futures position carries currency exposure only on margin and accumulated profit and loss, not on the full notional, so a basket of contracts denominated in local currencies delivers the equity return without that translation. Restoring it may require currency forwards, which carry their own transaction and roll costs and must be rolled across multiple currency pairs.
Regional proxies come with a tracking error that peaks in crisis
For investors aiming to track the MSCI ACWI Index, using regional proxies comes at a measurable cost. Baskets of regional futures introduce tracking error that widens in periods of stress, along with currency exposures to manage and margin to post at several exchanges. A single USD-denominated contract on the index avoids them. Investors using these proxies may therefore need to weigh the associated tracking error, FX exposure and margin requirements against considerations such as liquidity, trading capacity and roll costs.


Subscribe todayto have insights delivered to your inbox.
1 GICS® is the industry-classification standard jointly developed by MSCI and S&P Dow Jones Indices.
2 Average pairwise correlation is the mean of all pairwise correlations, calculated using weekly returns. The two periods are July 2016 to August 2021 and September 2021 to August 2026. Countries are the top six by country weights in the MSCI World Index and the MSCI Emerging Markets Index.
3 Gorman, L.R., S.G. Sapra and R.A. Weigand. 2010. "The Role of Cross-Sectional Dispersion in Active Portfolio Management." Investment Management and Financial Innovations.
The content of this page is for informational purposes only and is intended for institutional professionals with the analytical resources and tools necessary to interpret any performance information. Nothing herein is intended to recommend any product, tool or service. For all references to laws, rules or regulations, please note that the information is provided “as is” and does not constitute legal advice or any binding interpretation. Any approach to comply with regulatory or policy initiatives should be discussed with your own legal counsel and/or the relevant competent authority, as needed.