Dispersion in Equity Markets
When stock returns are more spread out, that creates more opportunities for active managers. When dispersion of returns is tighter, there are fewer opportunities.
The charts below show equity-return dispersion in developed (DM) and emerging markets (EM) using a common measure known as cross-sectional volatility (CSV). Over the last 25 years, dispersion of stock returns (CSV profiles) were higher in EM compared to DM most of the time. This is consistent with previous research that found greater outperformance potential by active managers in EM.
We had two key findings. First, we found that dispersion of returns followed the market cycle: In more turbulent markets — when dispersion increased — managers had greater potential to outperform. Second, we found that in both regions, stock-specific contributions were lowest during times of financial distress, as correlations among stocks rose. Overall, the majority of dispersion (60% to 90%) was explained by stock-specific contribution — as opposed to common factors such as country, industry and styles (see the second line in both charts).
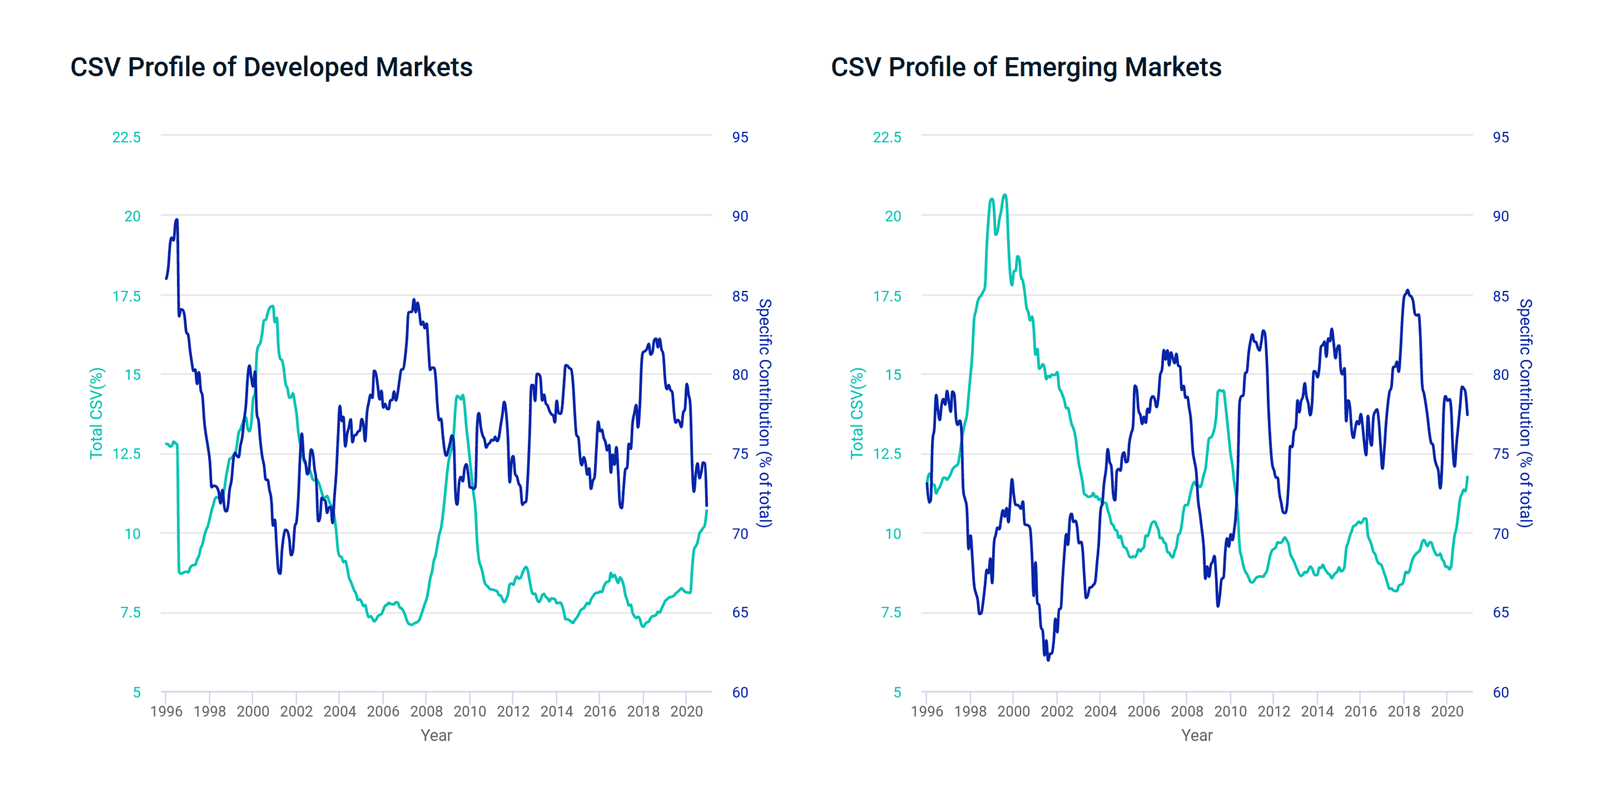
Data from Dec 29, 1995, to Nov 30, 2020. Cross-sectional volatility (CSV) is the standard deviation of a set of asset returns over a single time period and over time. Please note our plots show the 12-month average CSV referenced in "Selected geographic issues in the global listed equity market" (opens in a new tab).

Subscribe todayto have insights delivered to your inbox.
Global Investing Trends
Investing globally can help investors work toward global diversification, tap into new opportunities for growth and harness the potential in the rise in importance of emerging markets.
Evolution of Emerging Markets
Over the past 20 years, emerging markets have increased significantly as a share of the MSCI ACWI Index.
The State of Global Investing
Over long periods, starting valuations and dividend growth have been primary factors in explaining equity market performance.
The content of this page is for informational purposes only and is intended for institutional professionals with the analytical resources and tools necessary to interpret any performance information. Nothing herein is intended to recommend any product, tool or service. For all references to laws, rules or regulations, please note that the information is provided “as is” and does not constitute legal advice or any binding interpretation. Any approach to comply with regulatory or policy initiatives should be discussed with your own legal counsel and/or the relevant competent authority, as needed.