Energy-Sector Drivers
Looking at sectors through a factor lens may provide additional insights for investors in terms of explaining performance. To help us do that, we look at the energy sector using MSCI FaCSTM, a classification standard developed by MSCI for evaluating, implementing and reporting style-factor exposure in equity portfolios.
Energy, as represented by the MSCI ACWI IMI Energy Index, has been the best-performing sector in the year to date (+21.2% vs. the MSCI ACWI IMI Index's -12.9%).1 The most recent FaCS snapshot of the index shows strong exposure to the momentum, yield and value factors. Although the war in Ukraine had a significant impact on the supply and price of oil, the energy sector had started to recover from the impact of 2020's COVID-19-related lockdowns by early 2021, as illustrated by the upward trend for momentum exposure shown in the second chart below.
That chart also shows the evolution of the energy index's yield exposure, which has been positive over the last 10 years. We can see that, over the last few years, yield was almost a mirror image of momentum. It started to pick up, ahead of trend in 2020, when energy stocks underperformed and the major U.K. oil firms cut dividends. Then, in 2021, when energy prices and energy companies' share prices recovered, yield dipped as dividend payouts remained mostly unchanged — until recently, that is.
Finally, let's take a closer look at energy's value exposure, which was positive through most of the last 10 years. The only exception was in 2016, when crude oil got close to USD 40 per barrel due to oversupply and shifting OPEC policies, but then global activity in energy companies' share prices improved (energy sector +28.4% vs. +8.4% for the MSCI ACWI IMI).2
Regardless of the specific sector or period in question, awareness of how a sector's factor exposure can change through time can help investors improve their understanding of sector dynamics as they manage their portfolios' sector allocations.
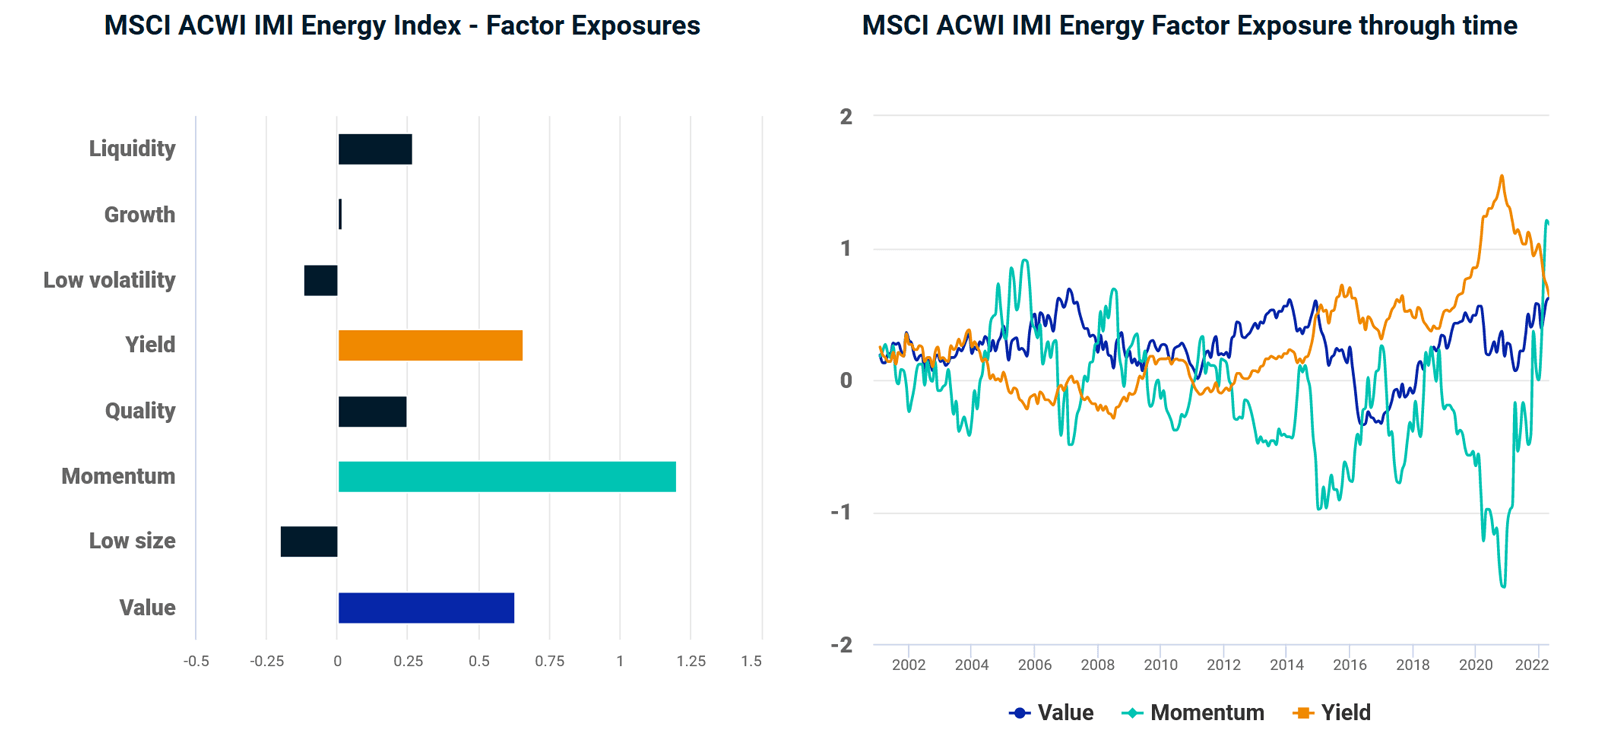
Source: MSCI, GEMLT FaCS exposures as of April 2022. Source: MSCI, GEMLT FaCS exposures from December 2000 - April 2022.


Subscribe todayto have insights delivered to your inbox.
Global Investing Trends
You’ll find insights provided in research papers, blogs and a Chart of the Week that succinctly puts topical issues in context.
Valuations Can Help in Evaluating Sectors
Along with other factors, comparing current sector valuations to longer-term averages has helped investors as they make decisions about whether to rotate in or out of specific sectors.
Sector Momentum
Our research has shown that an industry momentum approach, which involves investing in industries with the best recent performance, outperformed broad-market equity indexes in developed-market regions from 2000 to 2021.
1 Net returns in USD, as of April 29, 2022.', 'Net returns in USD, as of Dec. 31, 2016.
The content of this page is for informational purposes only and is intended for institutional professionals with the analytical resources and tools necessary to interpret any performance information. Nothing herein is intended to recommend any product, tool or service. For all references to laws, rules or regulations, please note that the information is provided “as is” and does not constitute legal advice or any binding interpretation. Any approach to comply with regulatory or policy initiatives should be discussed with your own legal counsel and/or the relevant competent authority, as needed.