Not All Listed Stocks Are Investable: The Concept of Free-Float Market Capitalization
When assessing a potential investment within a given market, investors may want to consider the difference between total and free-float market capitalization. The former indicates company size (total market value), and the latter the level of capital (equity) available for investment. The free-float calculation uses the number of outstanding shares available for trading by international investors and is used by most indexes and index providers.
Shares may be excluded from a free-float calculation if:
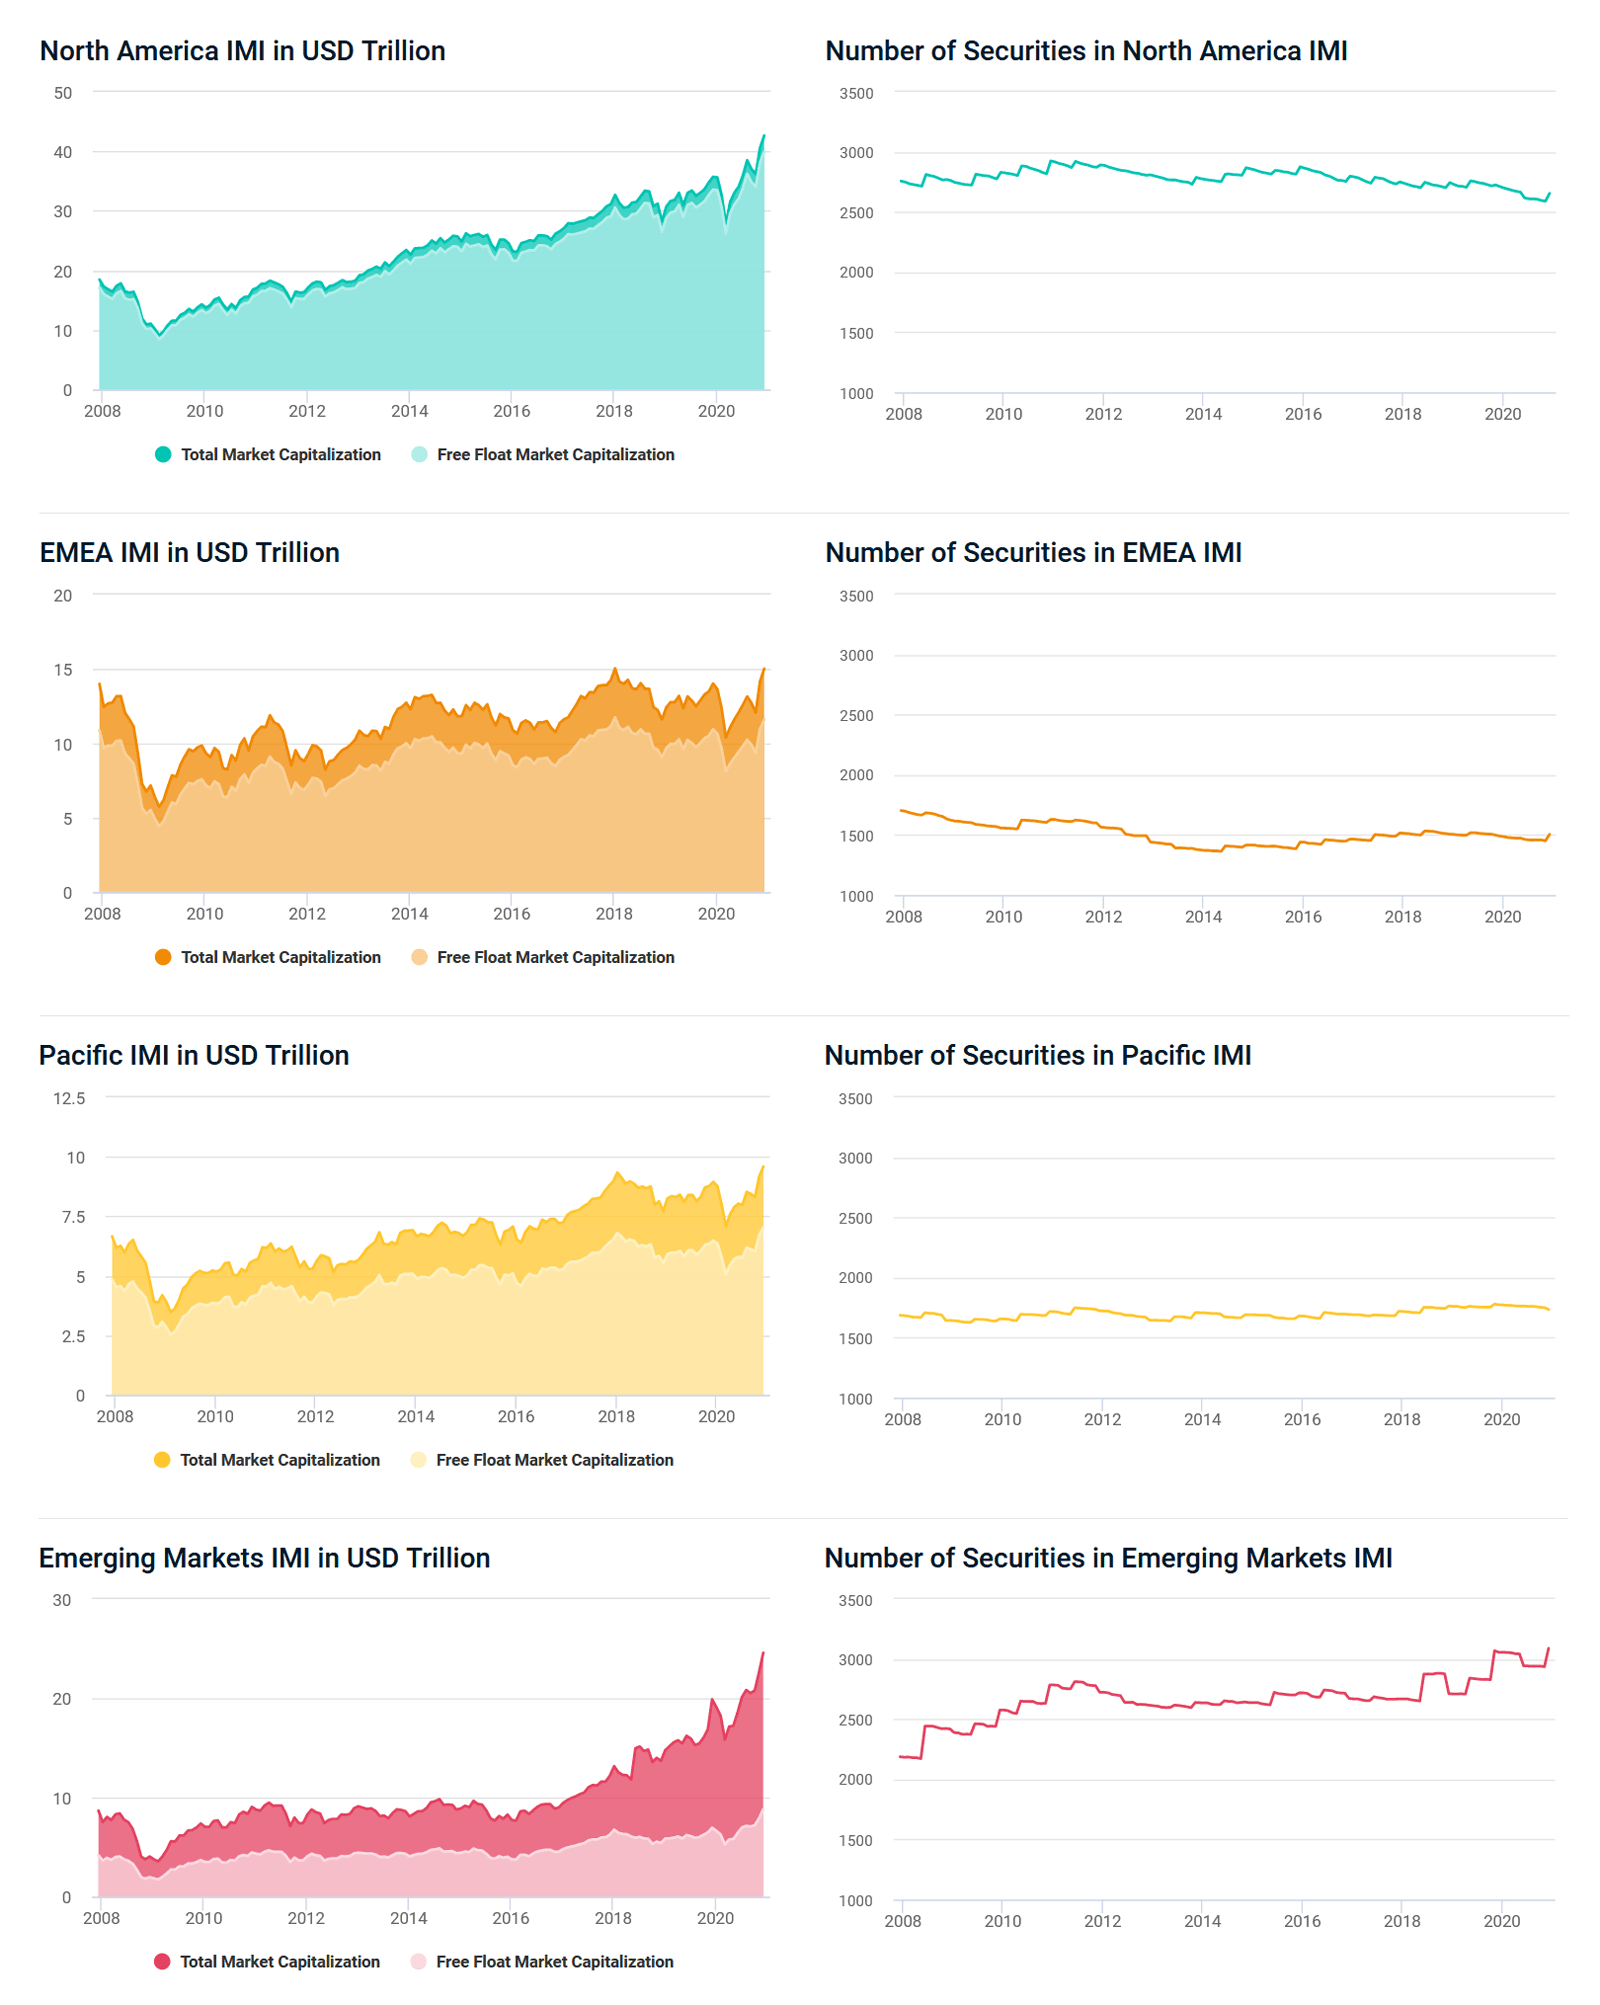
Looking at the MSCI North America Investable Market Index (IMI), for example, we see the difference between total market capitalization and free-float market capitalization was relatively stable throughout the period shown, as it was for the MSCI EMEA and MSCI Pacific IMI, though differences in these regions were larger. The number of securities in all three markets fell slightly between 2010 to 2012, with MSCI EMEA IMI showing the largest and most persistent decline.
When we look at the MSCI Emerging Markets IMI, however, the story changes. The difference between total and free-float market capitalization has increased over time, driven by a sharp rise in total market cap. The number of securities in the index also has grown, especially with the inclusion of China A shares, beginning in 2018. These results suggest that companies coming to market more recently may have a greater share of capital that is not accessible to international investors.
Investors can compare total and free-float market capitalization to better understand the capital structure of a company and monitor large ownership stakes, which, when sold, may impact share prices. MSCI research also has shown a link between higher free float and higher levels of corporate governance.
Note: EMEA IMI is back filled with EU IMI prior to May 2010.

Subscribe todayto have insights delivered to your inbox.
Global Investing Trends
Investing globally can help investors work toward global diversification, tap into new opportunities for growth and harness the potential in the rise in importance of emerging markets.
Where next in terms of Global Growth?
While most countries’ real GDP growth was buffeted in 2020 by the COVID-19 pandemic, the emerging market & developing economies were less affected (-3.3%) than advanced ones (-5.8%).
Does positive GDP growth lead to strong stock returns?
Traditionally, GDP growth has been thought of as a leading indicator for domestic stock-market performance. But has this changed?
The content of this page is for informational purposes only and is intended for institutional professionals with the analytical resources and tools necessary to interpret any performance information. Nothing herein is intended to recommend any product, tool or service. For all references to laws, rules or regulations, please note that the information is provided “as is” and does not constitute legal advice or any binding interpretation. Any approach to comply with regulatory or policy initiatives should be discussed with your own legal counsel and/or the relevant competent authority, as needed.