Renewables in Private Markets: Climate Wins and Financial Gains
To examine the perception of a trade-off between climate impact and returns in renewable investments, we analyzed the returns of private investments in the renewable electricity sub-industry (renewables) against those of the oil and gas drilling, exploration, production, and integrated oil and gas sub-industries (oil and gas).1 While the two sub-industry groups may differ in their operations, business models and supply chains, a comparative analysis can provide insights into the investment appetites and the relative robustness of the exit markets in both spaces.
A trade-off between climate impact and return — a misconception?
In recent years, private funds' exits from renewable investments have generated higher pooled2 investment multiples3 (gross of fees) compared to exits in oil and gas. Looking at the investment multiples, which compared the total investments and the total proceeds at the holding level, renewable exits outperformed oil and gas in every year between 2016 and 2023, as of Q4 2023.
To incorporate the role of cash-flow timing in the returns, we looked at the internal rate of return (IRR) (gross of fees) for both sub-industry groups. Our findings suggest that the median IRRs for the exited renewable and oil-and-gas investments were, for the most part, directionally in line with the investment-multiples findings, further reinforcing the outlined outperformance, as of Q4 2023.
The perception of a potential trade-off between climate impact and return may therefore not reflect the financial returns from renewable exits since 2016, making these assets more relevant to a wide range of energy investors, regardless of climate focus. In our blog post analysis as of Q3 2023, renewables' relatively strong exit market in recent years was associated with a surge in net capital inflows, providing the industry with the much-needed capital to achieve net-zero.
Sunny side up: Renewables have overtaken oil and gas since 2016
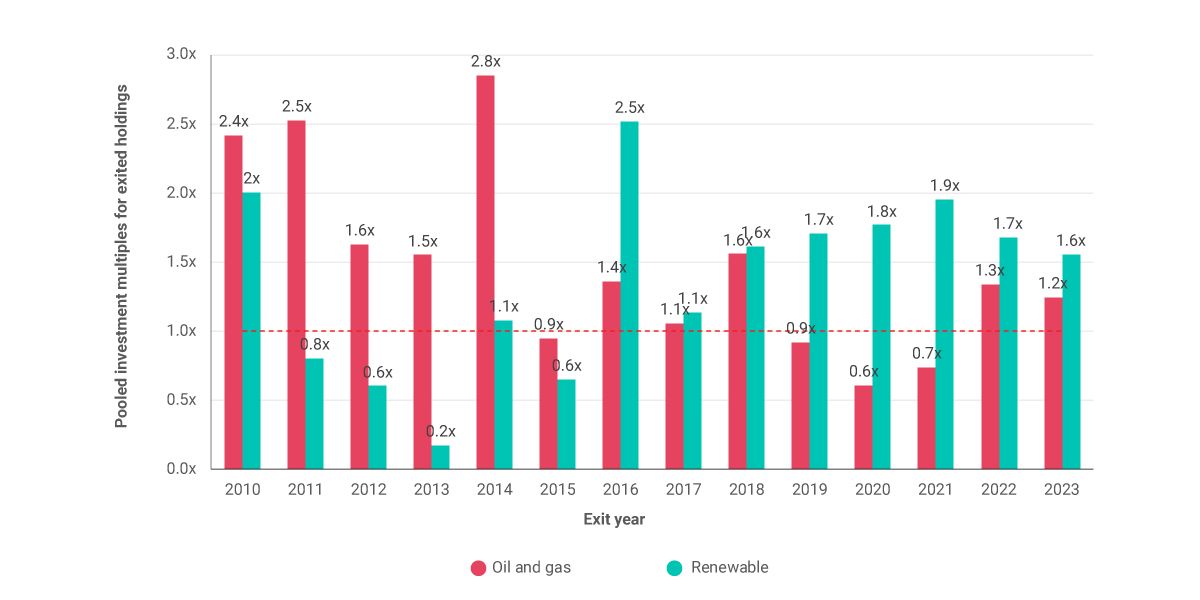
The chart is based on 1,146 unique exited holdings in 332 unique private-capital funds. These holdings have a complete cash-flow history (investments and proceeds). The total underlying paid-in capital is about USD 96.4 billion, while the total proceeds equal USD 125 billion (which includes USD 1.3 billion of remaining NAVs in the exited holdings). Data as of Q4 2023 from the MSCI Private Capital universe dataset. Source: MSCI Private Capital
Watt’s the cash-flow timing? An IRR perspective
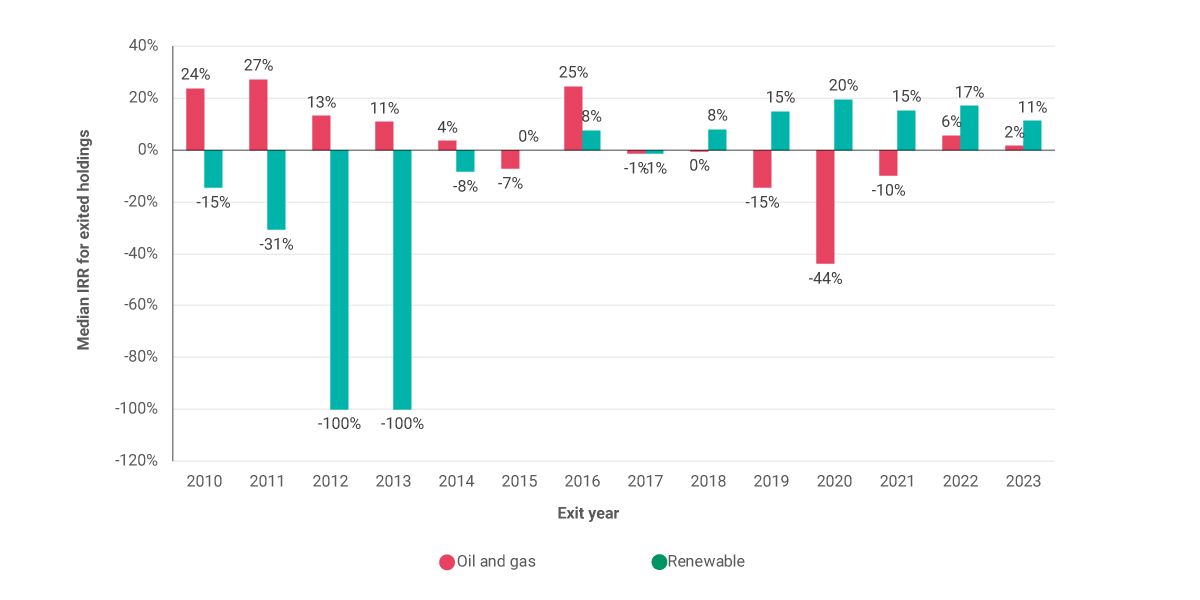
The chart is based on 1,403 unique exited holdings in 419 unique private-capital funds. These holdings have exit and investment dates. Data as of Q4 2023 from the MSCI Private Capital universe dataset. Source: MSCI Private Capital

Subscribe todayto have insights delivered to your inbox.
Bridging Greenhouse to Greenbacks: Renewables’ Returns in Private Funds
In recent years, there has been a notable shift in private investments in energy. Understanding these trends and the financial side of renewable investments may be key for investors looking to allocate private money to energy-transition opportunities.
In the Name of Climate: Private vs. Public Funds
In recent years, there has been a surge in climate-related names within both public and private funds, but their focus is often on different areas. We analyze the numbers to identify key trends and provide investors with greater clarity.
1 Sector definitions according to the Global Industry Classification Standard (GICS®). GICS is the global industry classification standard jointly developed by MSCI and S&P Global Market Intelligence.2 “Pooled” implies that within an exit year, all the exited holdings’ investments and proceeds are aggregated.3 Investment multiple = Total proceeds/Total investments. The proceeds may include some remaining NAVs in the exited holdings. Investment multiples are gross of fees and are only calculated for exited holdings with complete cash-flow history. Data as of Q4 2023.
The content of this page is for informational purposes only and is intended for institutional professionals with the analytical resources and tools necessary to interpret any performance information. Nothing herein is intended to recommend any product, tool or service. For all references to laws, rules or regulations, please note that the information is provided “as is” and does not constitute legal advice or any binding interpretation. Any approach to comply with regulatory or policy initiatives should be discussed with your own legal counsel and/or the relevant competent authority, as needed.