Scenario Analysis: Surging Oil and Energy Prices
Institutional investors might be concerned that escalating unrest in the Middle East could push oil prices higher, as geopolitical risk has once again come into focus for this group. A sustained rise in energy costs may fuel inflation and weigh on economic growth, affecting portfolios. In this quick take, we use the MSCI Macro-Finance Analyzer to evaluate the impact of two energy-price shocks on the U.S. economy and financial markets.1
- 30% energy-price shock: Energy-price increases lead to higher inflation, with growth slightly below the baseline in subsequent years. U.S. equities decline by 5%, the Treasury yield curve shifts up by 30 basis points (bps) and five-year U.S. breakeven inflation rises by 50 bps.
- 60% energy-price shock and shallow recession: A larger energy-price shock, accompanied by a shallow recession, results in a 14% sell-off in U.S. equities. The one- and 10-year Treasury yields increase by 40 and 50 bps, respectively, while five-year U.S. breakeven inflation rises by 85 bps.
Two scenarios for an energy-price shock
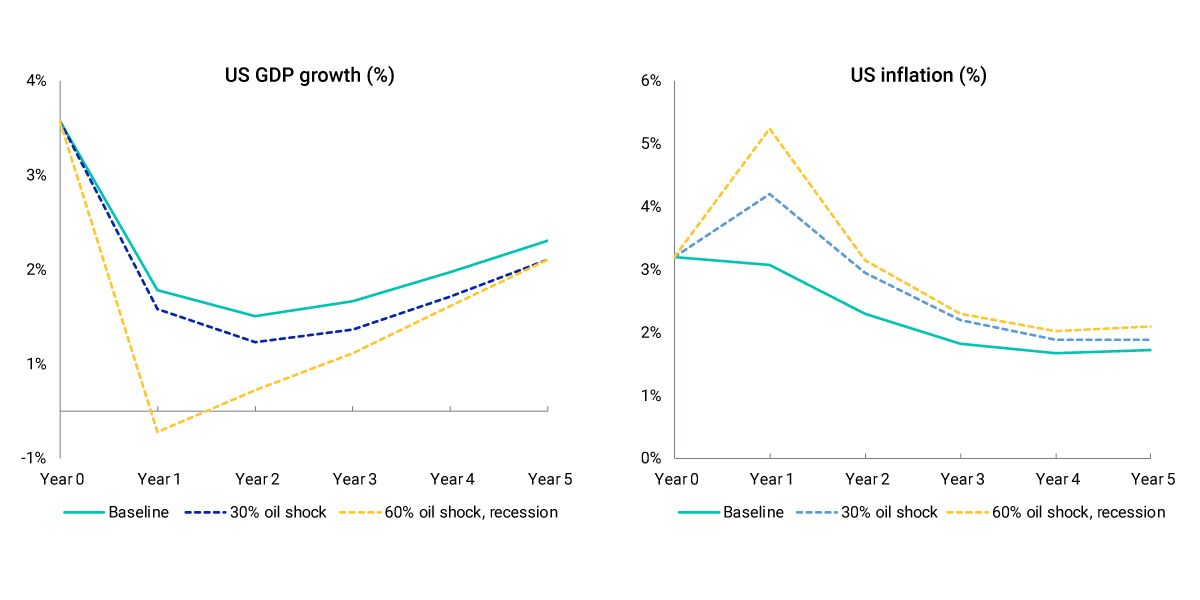
GDP and inflation paths were generated with the MSCI Macro-Finance Analyzer using the MSCI baseline scenario as of June 30, 2024.
Portfolio impact under our scenarios
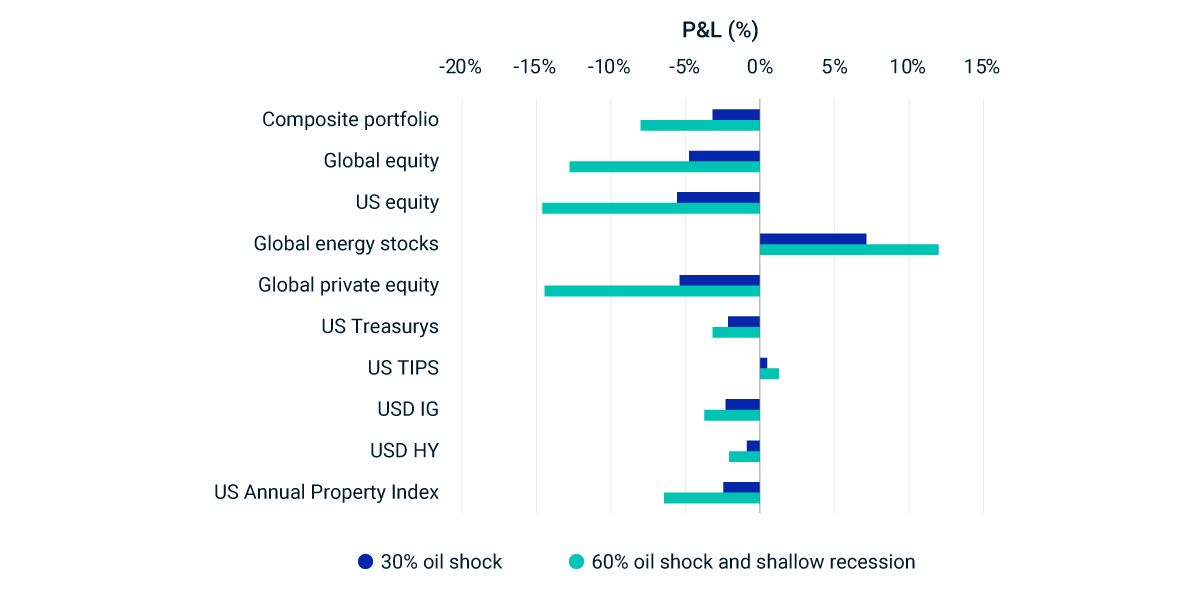
Portfolio impact of the scenarios based on market data as of Oct. 9, 2024. The above stress-test results capture the effect of instantaneous repricing of the assets. Source: S&P Global Market Intelligence, MSCI

Subscribe todayto have insights delivered to your inbox.
Macro Scenarios in Focus: Hard-Landing Risks Keep Investors on Edge
After the Federal Reserve recently cut rates and indicated that further reductions were likely, the equity market rallied. But sell-offs in August and September signaled investor concerns about an economic slowdown. What are potential outcomes to consider?
Understanding Geopolitical Risk in Investments
Over the last 30 years, high geopolitical risk has been associated with lower equity returns and higher forecast volatilities. We show that measures of geopolitical risk have provided useful information beyond conventional measures of uncertainty.
MSCI Macro Finance Analyzer
Evaluate the effect of different macro scenarios on long-term risk and expected return on your portfolios.
1 We used the MSCI Macro-Finance Model to model different trajectories for the U.S. economy. The MSCI baseline as well as the stressed macroeconomic scenarios can be accessed via these links: 30% energy-price shock and 60% energy-price shock and shallow recession. 2 Treasury inflation-protected securities (TIPS) are represented by the iBoxx TIPS Inflation-Linked Index provided by S&P Dow Jones Indices. U.S. Treasurys, equities and corporate bonds are represented by MSCI indexes. Private equity is represented by model portfolios. U.S. real estate is represented by the MSCI/PREA U.S. AFOE Quarterly Property Fund Index. The composite portfolio is 50% global equities (35% public and 15% private), 10% U.S. Treasurys, 10% TIPS, 10% U.S. investment-grade bonds, 10% U.S. high-yield bonds and 10% U.S. real estate.3 The results are generated by using model correlations to propagate shocks to the portfolios, using MSCI's BarraOne®. MSCI clients can access the correlated BarraOne stress test here. A RiskMetrics® RiskManager® stress test can be downloaded from the MSCI Macro-Finance Analyzer (via the links above, by clicking the “Download” button).
The content of this page is for informational purposes only and is intended for institutional professionals with the analytical resources and tools necessary to interpret any performance information. Nothing herein is intended to recommend any product, tool or service. For all references to laws, rules or regulations, please note that the information is provided “as is” and does not constitute legal advice or any binding interpretation. Any approach to comply with regulatory or policy initiatives should be discussed with your own legal counsel and/or the relevant competent authority, as needed.