Macro Scenarios in Focus: Hard-Landing Risks Keep Investors on Edge
Key findings
- While the U.S. stock-market sell-offs in August and September hinted at concerns about a potential hard landing, the equity rally following the Federal Reserve's rate cut suggested investor confidence in a soft landing.
- We outlined alternative scenarios to our baseline macroeconomic outlook, evaluating the potential market impacts of a hard landing, inflation resurgence or a scenario of increased productivity.
- In the hard-landing scenario, the value of a diversified portfolio of global equities and U.S. bonds could decline by 6%, while the inflation-resurgence scenario could result in an 8% loss, as both equities and bonds experience sell-offs.
After the Federal Reserve cut the policy rate by 50 basis points (bps) last month and indicated that further reductions were likely, the equity market rallied, reflecting investor confidence in the Fed's ability to engineer a soft landing.[1] But the sell-offs in August and September — when U.S. equities declined by 6.2% and 4.3%, respectively — signaled potential investor concerns about an economic slowdown. What are the potential outcomes for investors to consider?
In our hard-landing scenario, which assumes a GDP contraction and declining inflation, U.S. equities could drop by 14%, while a diversified portfolio of global stocks and U.S. bonds might fall by 6%. In the scenario of resurgent inflation, this portfolio could lose 8%, as both bonds and equities sell off simultaneously.
Soft-landing baseline scenario, with downside risks
In the exhibit below, we present four macroeconomic scenarios, each offering potential trajectories for growth and inflation. The MSCI baseline scenario anticipates a moderate slowdown in GDP growth and gradual decline in inflation, pointing to a possible soft landing as monetary-policy measures take effect. Downside risks remain, however, with the hard-landing scenario — in which we assume GDP will contract by 0.4% a year from now, compared to 1.3% growth under the MSCI baseline. There is also the risk of inflation resurgence, where rising prices could lead to stagnant growth and increased pressure on interest rates. We also consider an upside scenario, where enhanced productivity drives robust growth without adding inflationary pressures.[2]
GDP and inflation under our scenarios

GDP and inflation paths were generated with the MSCI Macro-Finance Analyzer using the MSCI baseline scenario as of June 30, 2024.
First, we assessed five-year capital-market assumptions for various U.S. asset classes under the MSCI baseline scenario. As inflation gradually declines and growth remains positive, U.S. equities are expected to generate a five-year annualized return of 7.1%, while investment-grade and high-yield credit are projected to return slightly less. Nominal and inflation-linked sovereign bonds, meanwhile, could deliver solid returns exceeding 4%.
Assumptions for US capital markets under the MSCI baseline scenario
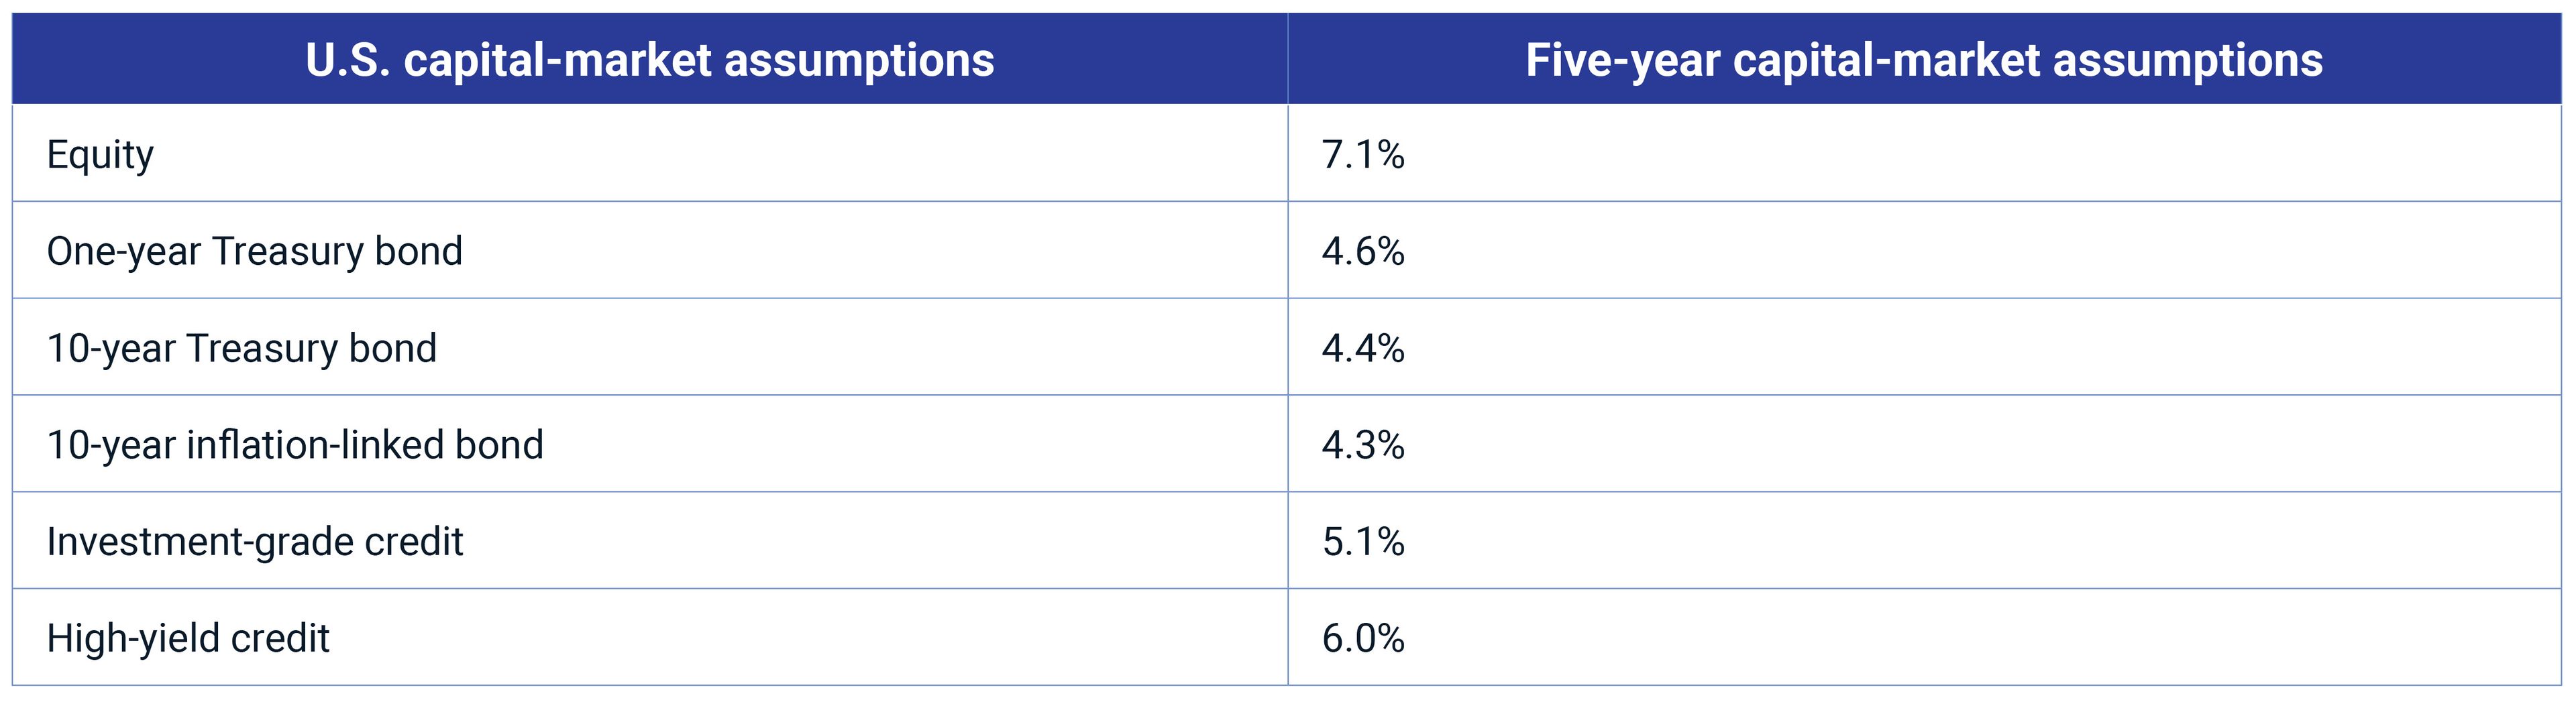
Capital-market assumptions are generated using the MSCI Macro-Finance Analyzer under the MSCI baseline scenario and are expressed as annualized returns.
Slowdown fears jittered markets
The sell-offs in August and September — when the MSCI USA Index declined by 6.2% and 4.3%, respectively — suggested investor concerns about a potential hard landing. Since then, the U.S. stock market has shown resilience and rallied after the Fed's 50-bp rate cut. The one-year U.S. Treasury yield, sensitive to Fed policy, dropped by approximately 90 bps since the end of July, and market prices are now implying 75 basis points of additional rate cuts by the end of the year. Some argue that the "dis-inverting" of the yield curve may also be the harbinger of recession this time around.[3] The scenarios outlined above allow investors to assess alternative scenarios to the baseline, like a hard landing or inflation resurgence. A shift from the MSCI baseline to one of the stressed scenarios would trigger an "instantaneous" repricing. The narratives and immediate market shocks under these alternative scenarios are illustrated in the exhibit below.
Our scenario assumptions
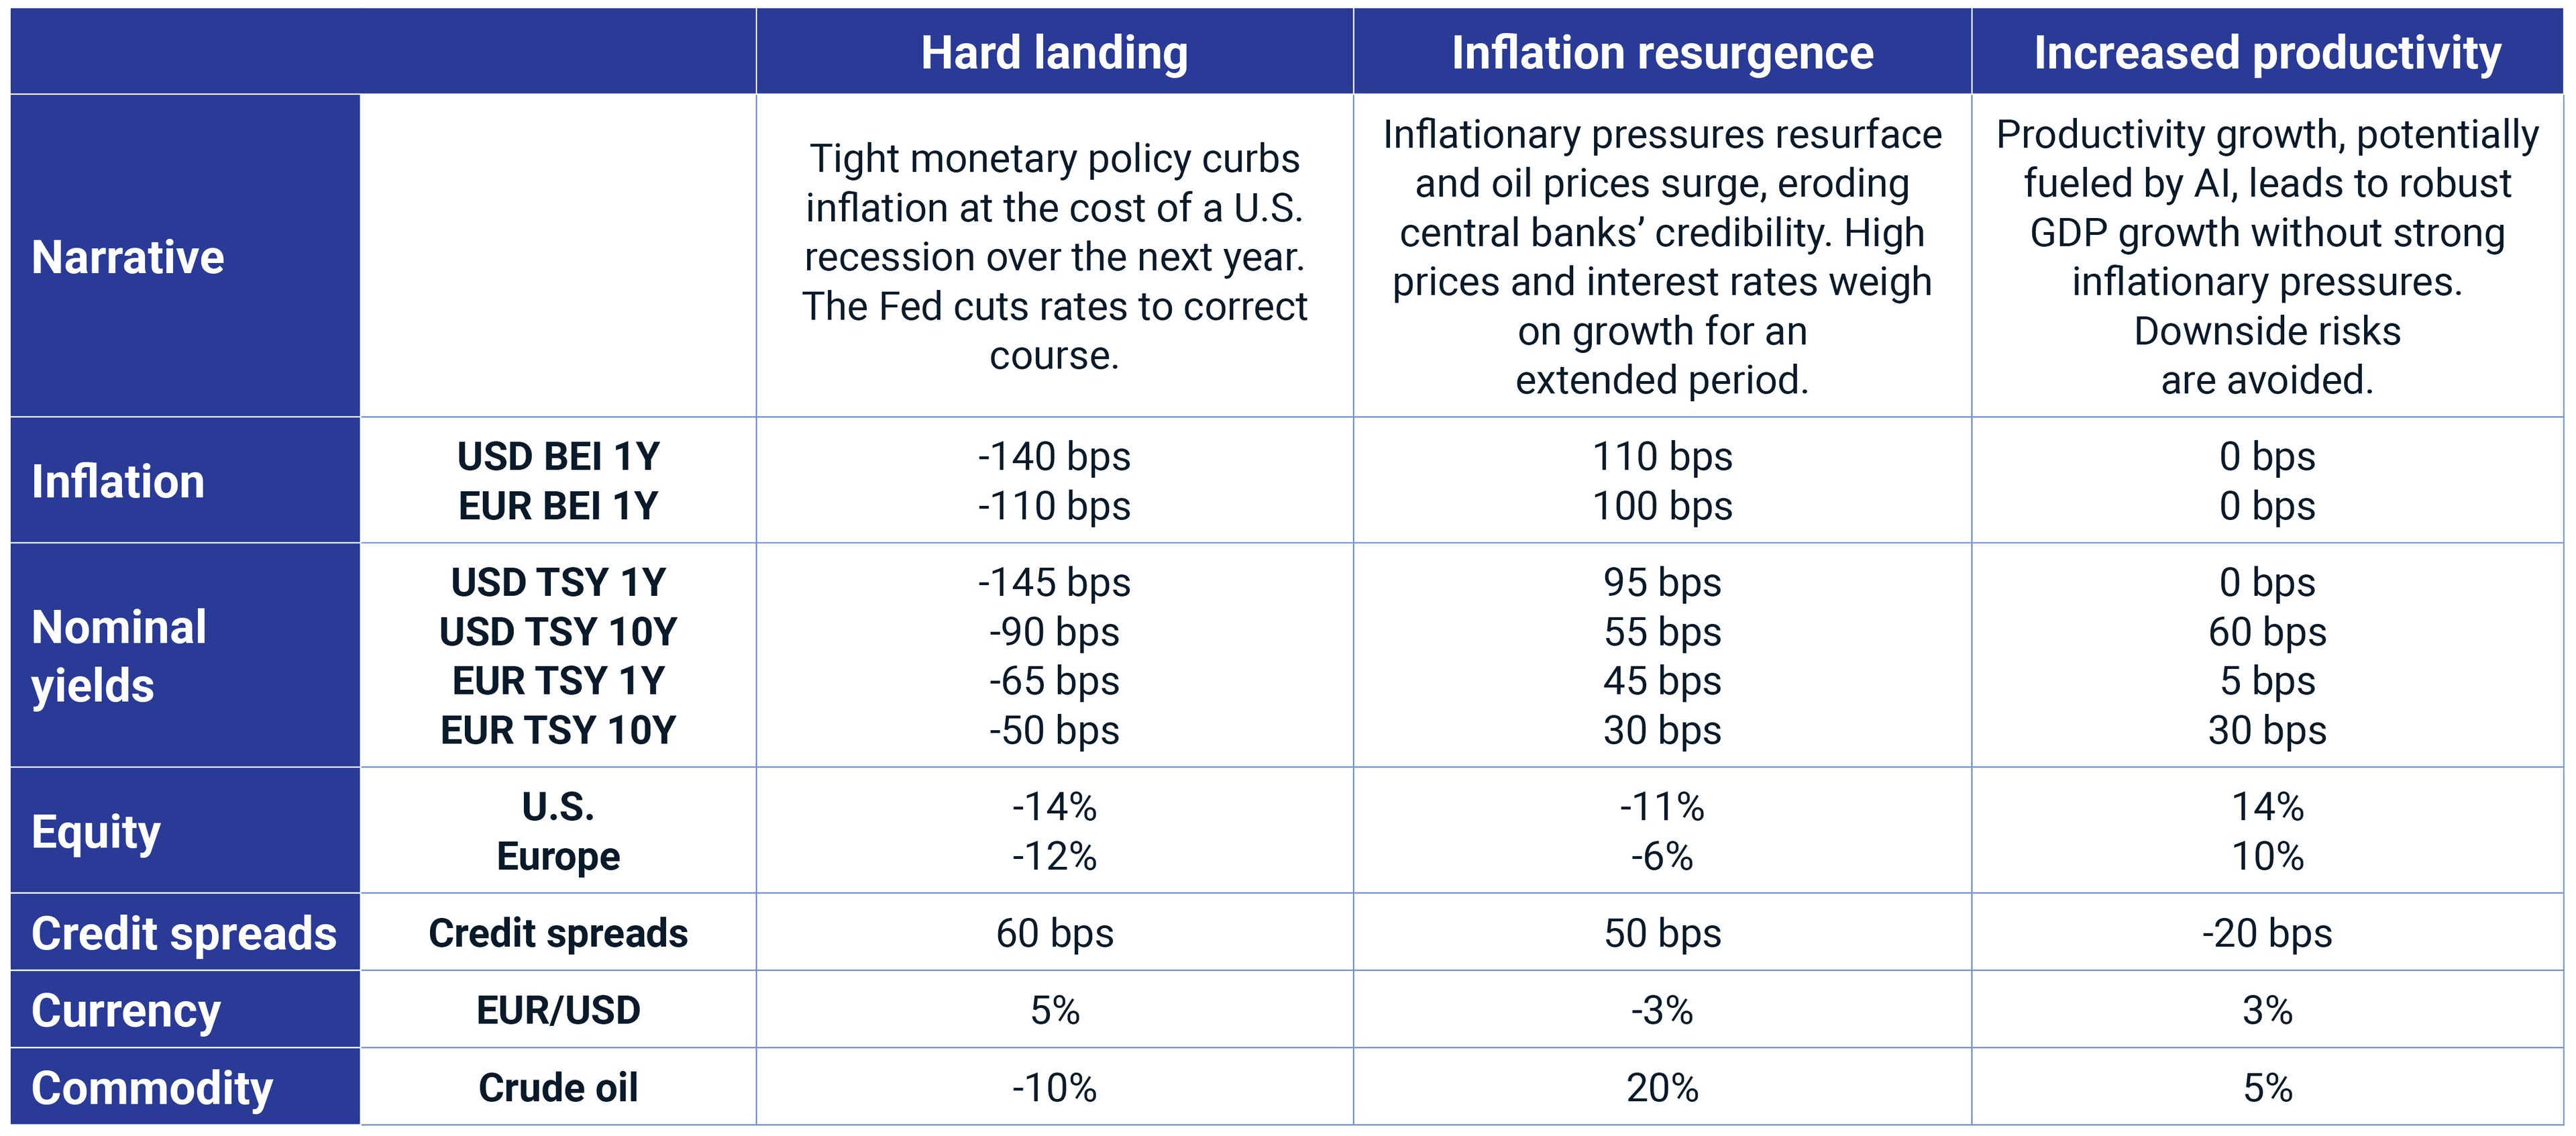
Assumptions about risk-factor shocks are informed by the MSCI Macro-Finance Analyzer, analysis of historical data and judgment. Breakeven inflation (BEI) is measured in bps. These are not forecasts, but hypothetical narratives of how alternative macroeconomic scenarios could affect multi-asset-class portfolios instantaneously. A positive shock for EUR/USD means the U.S. dollar is weakening relative to the euro.
Potential implications for financial portfolios
To evaluate the impact of these scenarios on multi-asset-class portfolios, we used MSCI's predictive stress-testing framework and applied it to a hypothetical global diversified portfolio consisting of global equities and U.S. bonds and real estate.[4] Under the hard-landing scenario, the portfolio's value dropped by 6%, with rallying bonds offsetting the equity sell-off. The inflation-resurgence scenario had the most severe impact, resulting in an 8% loss, as both bonds and equities traded down simultaneously. In our most optimistic, increased-productivity scenario, the portfolio gained 7%.[5] The exhibit below provides more detailed results.
Impact to portfolio values under our scenarios
Loading chart...
Please wait.
Portfolio impact of the scenarios based on market data as of Sept. 23, 2024. The above stress-test results capture the effect of instantaneous repricing of the assets. Source: S&P Global Market Intelligence, MSCI
Summing up
While MSCI's baseline scenario implies moderate growth, receding inflation and expected returns in line with long-term averages for equity markets, recent market volatility suggests investors remain on edge. Our alternative scenarios help put potential market impacts into perspective.
The authors thank Will Baker for his contributions to this blog post.


Subscribe todayto have insights delivered to your inbox.
1 Nicholas Megaw, Arjun Neil Alim, George Steer, Rafe Uddin and Mary McDougall, “S&P 500 closes at record high after Fed makes jumbo cut to US interest rates,” Financial Times, Sept. 19, 2024.2 We used the MSCI Macro-Finance Model to model different trajectories for the U.S. economy. The MSCI baseline, as well as the stressed macroeconomic scenarios, can be accessed via these links: hard landing, inflation resurgence and increased productivity. In previous “Macro Scenarios in Focus” blog posts, we considered the profit and loss over the next year. Now, we have aligned the stress tests with the MSCI Macro-Finance Analyzer: The three instantaneous stress tests result from the shift in expectations from the baseline to an alternative scenario, and the associated repricing. Since the baseline scenario is assumed to be priced in, it has no instantaneous stress test. However, the MSCI Macro-Finance Analyzer provides capital-market assumptions across various time horizons.3 Jennifer Hughes, “What is the yield curve really telling us about the odds of recession?” Financial Times, Sept. 21, 2024.4 Treasury inflation-protected securities (TIPS) are represented by the iBoxx TIPS Inflation-Linked Index provided by S&P Dow Jones Indices. U.S. Treasurys, equities and corporate bonds are represented by MSCI indexes. Private equity is represented by model portfolios. U.S. real estate is represented by the MSCI/PREA U.S. AFOE Quarterly Property Fund Index. The composite portfolio is 50% global equities (35% public and 15% private), 10% U.S. Treasurys, 10% TIPS, 10% U.S. investment-grade bonds, 10% U.S. high-yield bonds and 10% U.S. real estate.5 The results are generated by using model correlations to propagate shocks to the portfolios, using MSCI's BarraOne®. MSCI clients can access BarraOne and RiskMetrics RiskManager® files for these scenarios on the client-support site.
The content of this page is for informational purposes only and is intended for institutional professionals with the analytical resources and tools necessary to interpret any performance information. Nothing herein is intended to recommend any product, tool or service. For all references to laws, rules or regulations, please note that the information is provided “as is” and does not constitute legal advice or any binding interpretation. Any approach to comply with regulatory or policy initiatives should be discussed with your own legal counsel and/or the relevant competent authority, as needed.