Why Energy Firms’ Performance Varied: US vs. Europe
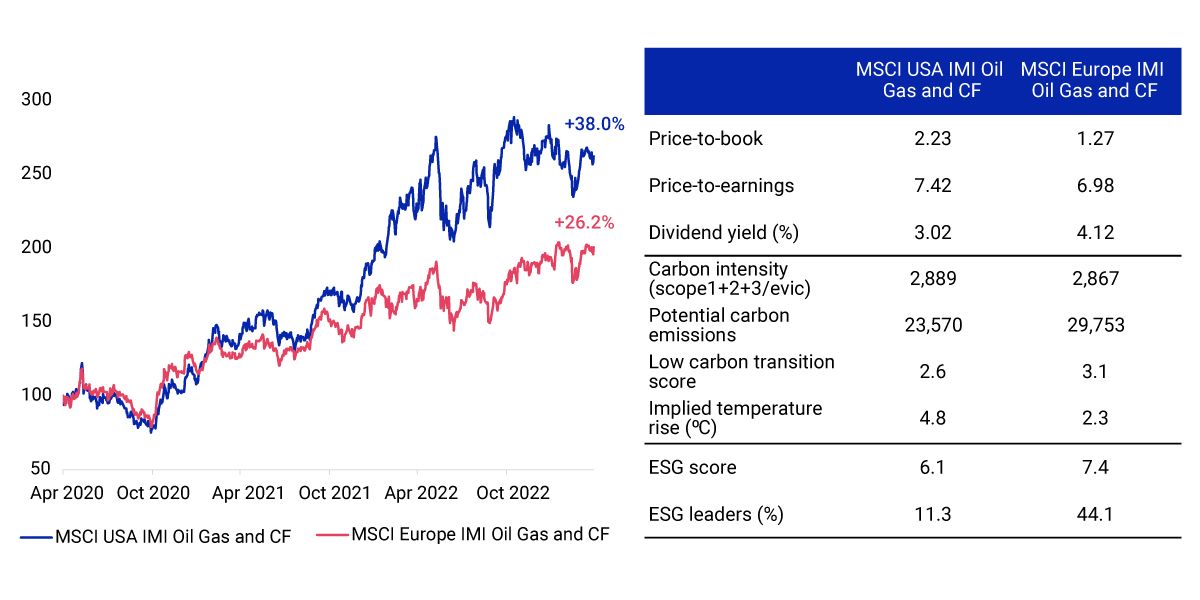
Since the end of the U.S. recession in April 2020, companies in the oil, gas and consumable-fuel industry have rallied and outperformed broad equity markets across the globe. Moreover, U.S. firms have outperformed their European counterparts, as measured by the MSCI USA IMI Oil Gas and Consumable Fuel Index's returning 11.8% per year more than the MSCI Europe IMI Oil Gas and Consumable Fuel Index over the last three years in gross USD terms. For context, the long-term (April 2013 – April 2023) performance of the two indexes have been quite similar at 5.2% and 5.0% per year, respectively.
At the same time, the European companies, on average, exhibited higher low carbon-transition scores and better ESG profiles, indicating they may be more resilient to climate risks and potentially positioned to benefit from climate-related opportunities.
Did the different sustainability profiles play a role in the regional performance difference?
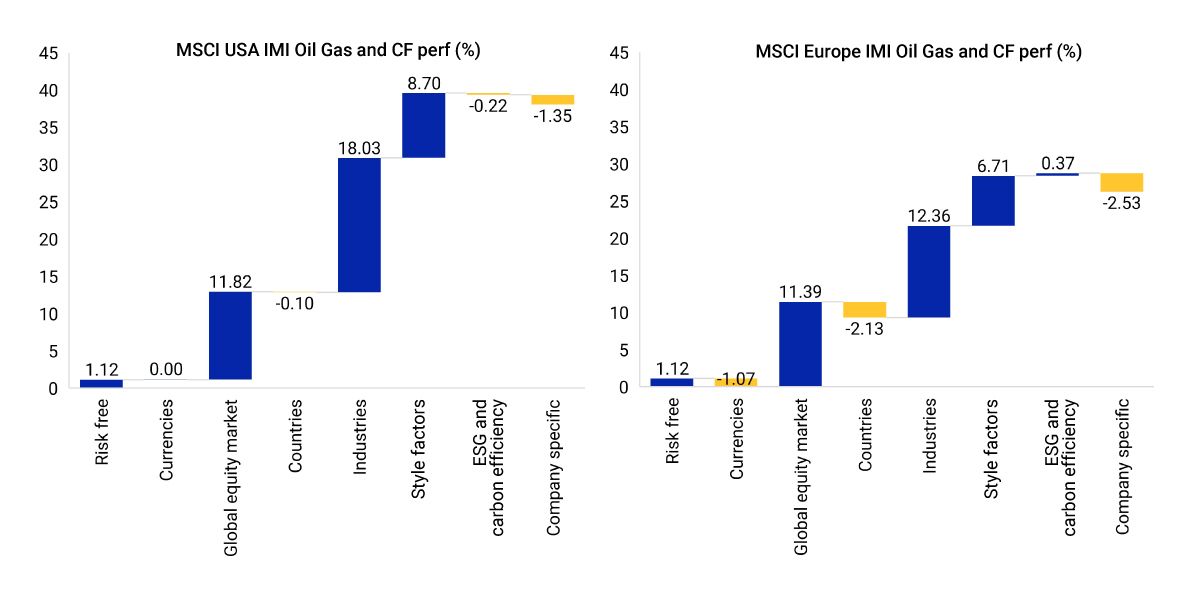
A deeper look into the performance decomposition of the indexes showed that the performance lag in Europe stemmed largely from industry effects and, to some extent, country and currency effects. The oil- and gas-exploration and -production sub-industry, which was the primary beneficiary of the energy-sector rally, represented 30% of the U.S. index but only 2% of the European index, which was dominated by integrated oil and gas (92%). That sub-industry benefited from the energy rally, as well, but to a lesser extent. At a factor level, the higher exposure of the European index to the ESG and carbon-efficiency factors did not detract from performance.
Over the period of study, industry effects played a larger role than sustainability characteristics.
Index performance, fundamentals and sustainability characteristics

Performance in gross USD. Right table as of April 28, 2023.
Performance attribution for oil, gas and consumable fuel in the US and Europe

Period from April 30, 2020, to April 28, 2023. Annualized in gross USD.
Subscribe todayto have insights delivered to your inbox.
Energy-Sector Drivers
Looking at sectors through a factor lens may provide additional insights for investors in terms of explaining performance.
The Climate Transition Is Increasingly About Opportunity
Climate-friendly policies and regulations and the massive reallocation of capital needed in the coming years to ensure a successful shift to a net-zero economy should continue to expand the range of opportunities for both companies and investors.
European Governments Rescue Utilities Amid Gas Crisis
Amid the Ukraine war, some of the largest European utilities have requested government support to offset losses from buying supplies at much higher prices. We look at which companies may be at greatest risk from soaring energy prices.
The content of this page is for informational purposes only and is intended for institutional professionals with the analytical resources and tools necessary to interpret any performance information. Nothing herein is intended to recommend any product, tool or service. For all references to laws, rules or regulations, please note that the information is provided “as is” and does not constitute legal advice or any binding interpretation. Any approach to comply with regulatory or policy initiatives should be discussed with your own legal counsel and/or the relevant competent authority, as needed.
