The MSCI Net-Zero Tracker
Video
July 9, 2021
The MSCI Sustainability Institute Net-Zero Tracker indicates the collective progress of the world's listed companies toward curing climate risk. The report, which highlights companies' alignment with global climate goals based on a series of indicators used by participants across capital markets, offers investors, companies, financial intermediaries and policymakers an objective gauge of advancement toward a low-carbon economy. The MSCI Net-Zero Tracker offers investors, companies, financial intermediaries and policymakers an objective gauge of the contribution by the world's listed companies to total carbon emissions and their progress toward a net-zero economy.
2 7 Months left to limit warming to 1.5 degrees C
Time remaining until listed companies deplete the emissions budget for limiting global temperature rise this century to 1.5 degrees C above preindustrial levels.
2 1 4 Months left to keep warming well below 2 degrees C
Time remaining until listed companies deplete the emissions budget for keeping global temperature rise this century well below 2 degrees C above preindustrial levels.
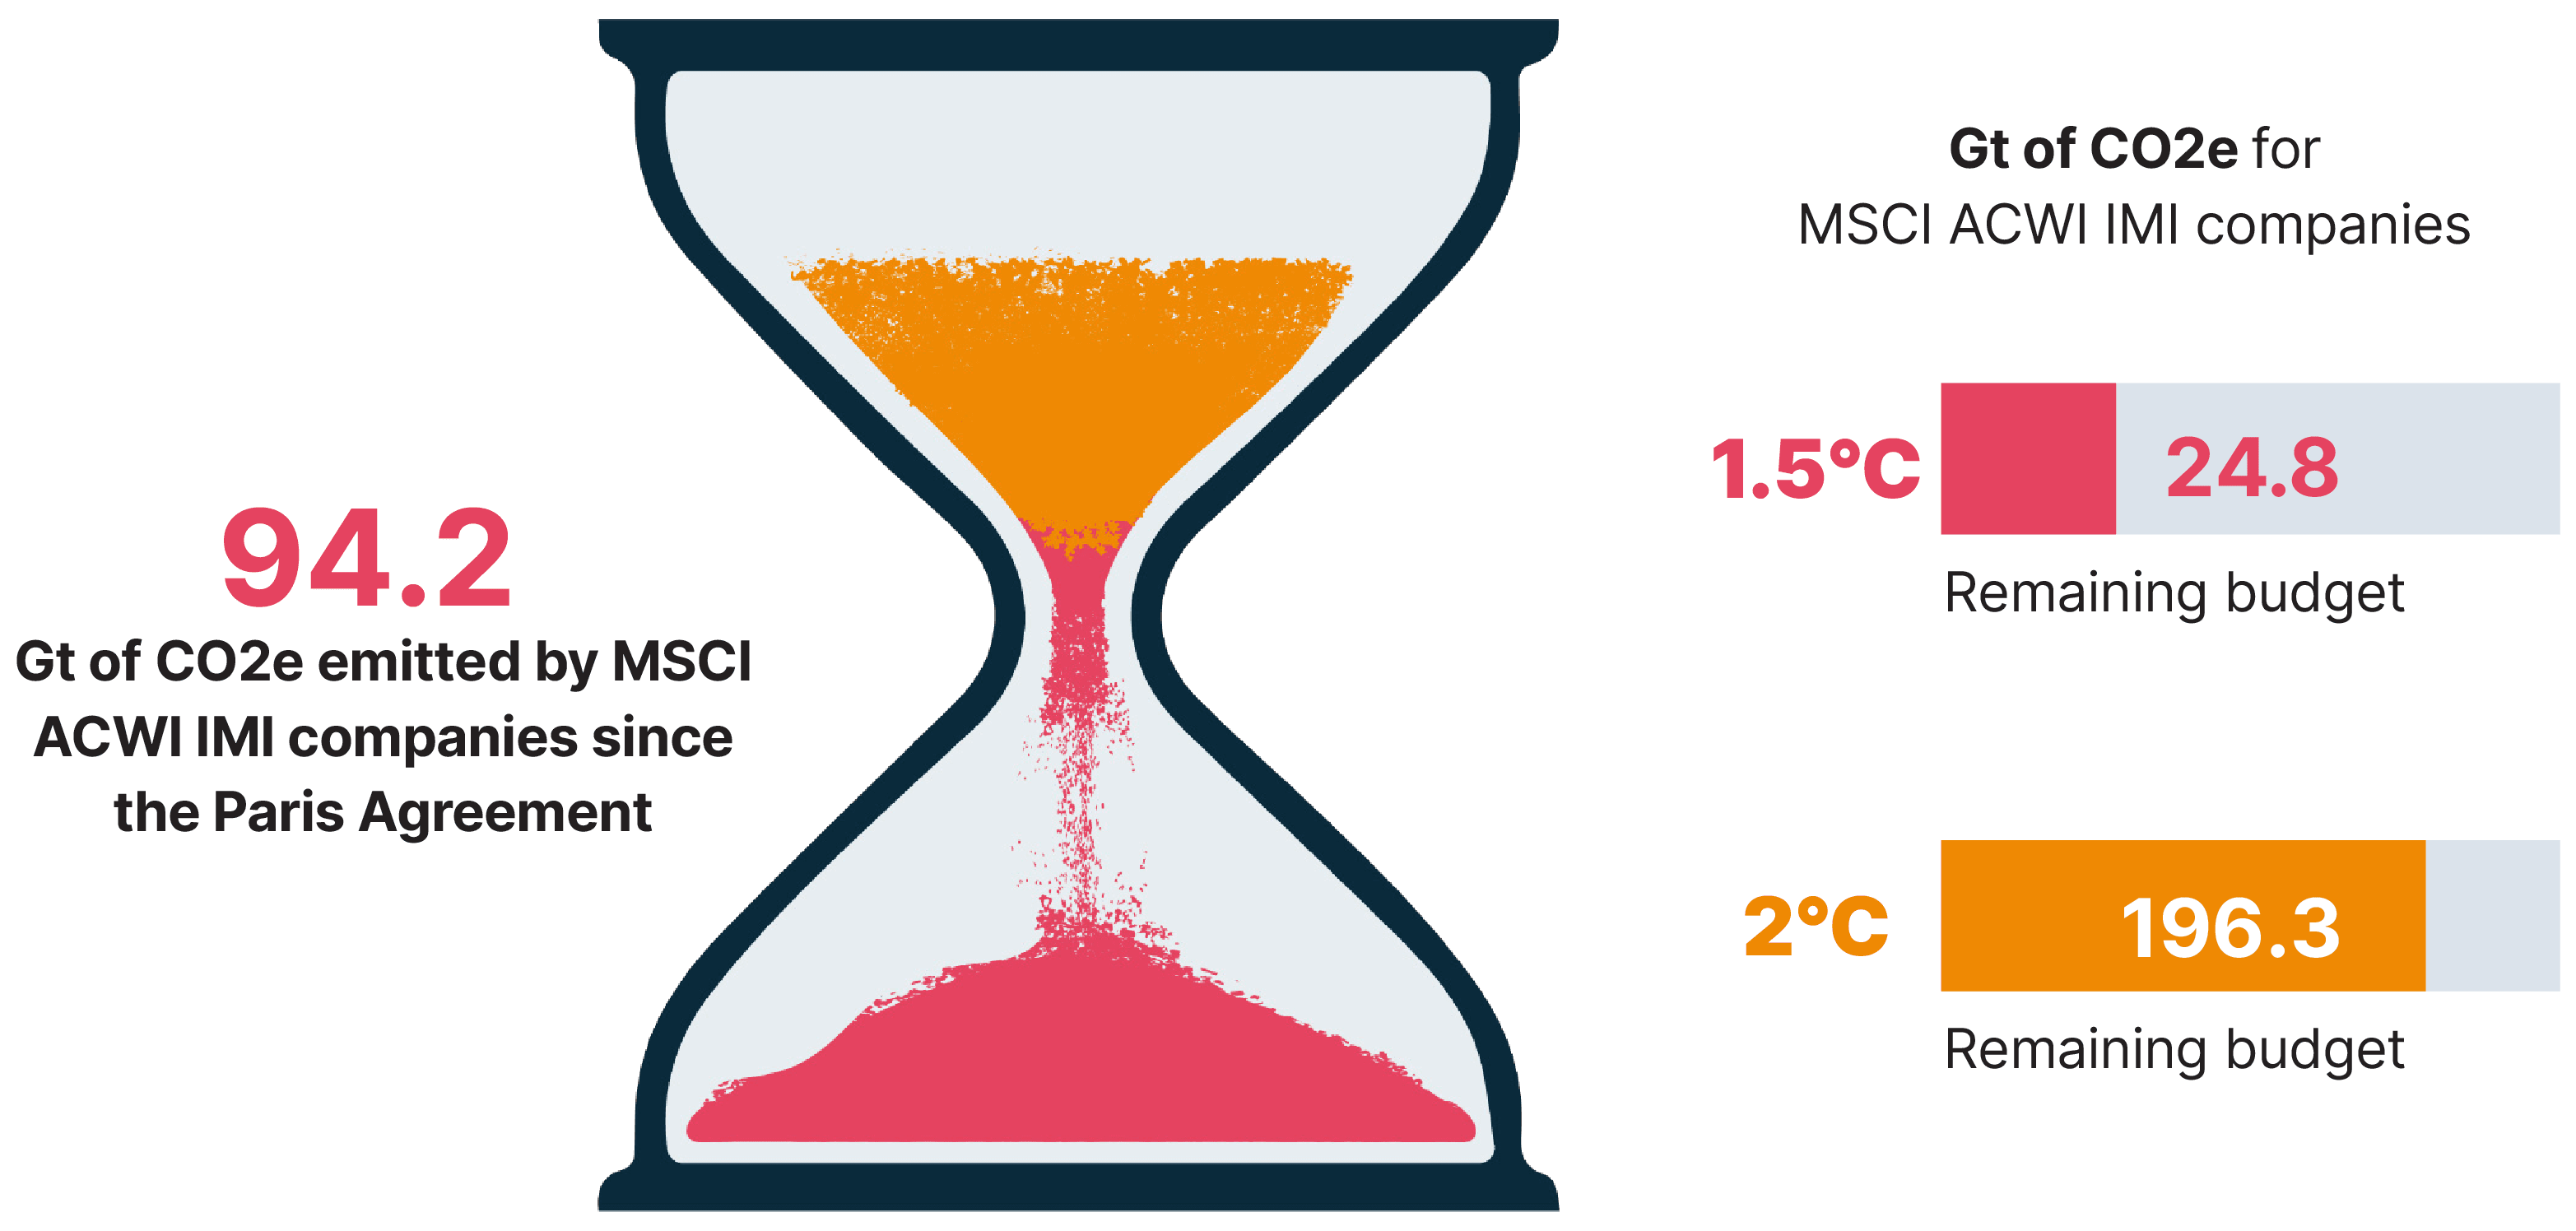
We're running out of time to reach net-zero emissions

Source: MSCI ESG Research, data as of Aug 31, 2024. The hourglass and countdown clock show annual total Scope 1 emissions of MSCI ACWI IMI constituents (not index-weighted) based on listed companies' reported emissions data and MSCI estimates as of Aug 31, 2024. Emissions for 2023 that companies haven't yet reported are based solely on MSCI estimates, given a lag in company reporting. The remaining future emissions budget to achieve a 1.5 degrees C and 2 degrees C warming scenario are calculated based on bottom-up estimates (sum of remaining emissions budget of all MSCI ACWI IMI constituents) as of Aug. 31, 2024.
Download previous Net-Zero Trackers
A periodic report on progress by the world's listed companies toward curbing climate change risk.
<p><span style="font-size: 12px;"><i><sup>1</sup>The MSCI ACWI Investable Market Index (IMI) captures large-, mid- and small-cap representation across 23 developed-market and 27 emerging market countries. With 9,189 constituents, the index covers approximately 99% of the global equity investment opportunity set, as of May 31, 2022. </i></span></p><p> </p>
The content of this page is for informational purposes only and is intended for institutional professionals with the analytical resources and tools necessary to interpret any performance information. Nothing herein is intended to recommend any product, tool or service. For all references to laws, rules or regulations, please note that the information is provided “as is” and does not constitute legal advice or any binding interpretation. Any approach to comply with regulatory or policy initiatives should be discussed with your own legal counsel and/or the relevant competent authority, as needed.