“G” is Just One Part of the ESG Story
Blog post
June 26, 2018
When it comes to ESG (environmental, social and governance) investing, conventional wisdom holds that G is the only part that really matters, as a window into overall management quality and providing insights and value for investors. Our analysis suggests this has not been true; that the E and S aspects of ESG did help sort the truly outstanding firms from a group that already shares an array of robust financial traits.
ESG MADE A DIFFERENCE AMONG STRONG CREATORS OF SHAREHOLDER VALUE
While our earlier research has largely focused on positive portfolio-level outcomes when applying ESG criteria, here we looked at individual companies with strong financial track records. We started with the MSCI ACWI Index and passed companies through several layers of filters for return on invested capital (ROIC), as well as economic spread, margins and asset turnover ratio. The result was a list of 100 stocks across the household products, personal products, IT services, health care technology and textiles, apparel and luxury goods industries.
Dividing these 100 firms into equal quintiles based on their MSCI ESG Ratings, we found that over the five years ending December 2017, the companies in the top quintile exhibited higher average ROIC, compared to those in the bottom quintile. Further, companies with high MSCI ESG Ratings were valued at a premium over their top-performing peers that had lower MSCI ESG Ratings.
Companies with highest ESG ratings delivered greatest ROIC
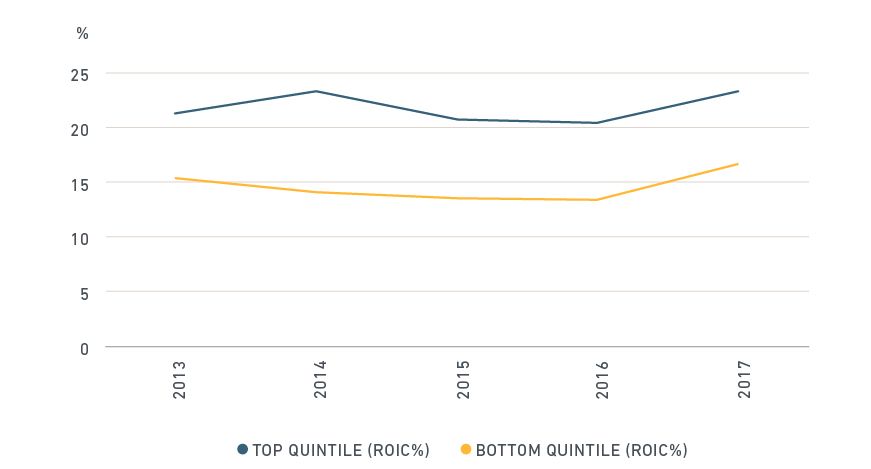
Source: MSCI ESG Research, Thomson Reuters Annual Data, December 2017. The chart shows the difference in average ROIC (%) values between the top 20 companies and the bottom 20 companies in the analytical sample by Industry Adjusted Score in each year from 2013-2017.
ENVIRONMENTAL AND SOCIAL ISSUES MADE A BIG DIFFERENCE
Governance scores for our sample group were almost universally high, as we might expect from companies managed well enough to produce strong financial results year after year. There was very little difference in governance scores between the top and bottom quintiles.
In contrast, we saw marked differences in how well companies in this group managed the environmental and social risks most pertinent to the long-term resilience of their business models. These risks ranged from matters, such as product chemical content and raw material sourcing for personal products firms to human capital management for IT companies.
Differences in "E" and "S" scores were consistently greater than differences in "G" scores
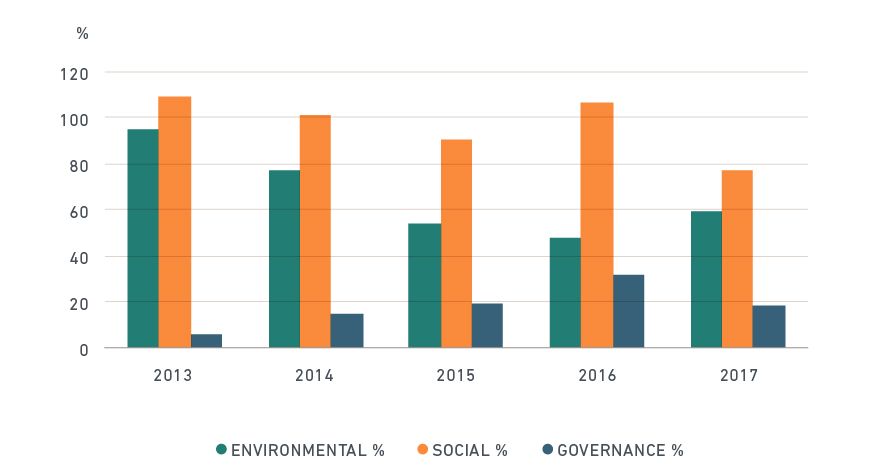
The chart shows the percentage difference in average environmental, social and governance pillar scores from 2013-2017 for the top- and bottom-quintile companies in the analytical set.
When it came to a select group of companies with excellent financial fundamentals, ESG information was more than just a proxy for strong governance. Better management of environmental and social risks and opportunities led to higher MSCI ESG Ratings, which, in turn, were associated with higher ROIC and valuation. In short, environmental and social scores provided an overlay investors may use to further differentiate performers, serving as a reminder that ESG is a tale told in three parts.
Further Reading


Subscribe todayto have insights delivered to your inbox.
The content of this page is for informational purposes only and is intended for institutional professionals with the analytical resources and tools necessary to interpret any performance information. Nothing herein is intended to recommend any product, tool or service. For all references to laws, rules or regulations, please note that the information is provided “as is” and does not constitute legal advice or any binding interpretation. Any approach to comply with regulatory or policy initiatives should be discussed with your own legal counsel and/or the relevant competent authority, as needed.