The Lowdown on High Real Yields
Real yields in many countries have surged to their highest levels in a decade. In the U.S., real yields fell significantly in the aftermath of the 2008 global financial crisis, but began increasing in the fourth quarter of 2021. As of Oct. 13, real yields exceeded 2% for all maturities across the yield curve. Other countries exhibited similar patterns, but there were significant differences in the levels of real yields (see plot below). As of Oct. 13, the level of the 10-year real yield was 2.3% in the U.S., 1.5% in the U.K., 0.4% in the eurozone and -0.5% in Japan.
Shorter-maturity real yields increased the most. Between Dec. 31, 2021, and Sept. 30, 2023, one-year real yields in the U.S., U.K. and eurozone surged by more than 500 basis points (bps), while the 10-year real yields rose by more than 250 bps.
Chasing yield carries risk
While high real yields might offer potential opportunities for investors, it is important to recognize the risks.
Recent increases in real yields coincided with large increases in inflation, which then triggered aggressive rate hikes by central banks. Looking forward, unexpectedly high inflation could result in central banks' continuing to pursue aggressive monetary policies that could put upward pressure on real yields.
Deterioration in governmental finances is another consideration. During this year's debt-ceiling drama, some investors contemplated that the U.S. government might be willing to miss some debt payments. Crossing this threshold could fuel thinking that even more extreme scenarios could occur — including payment shortfalls on all U.S. debt. We are far from this sort of dire scenario, but it is a potential long-run tail event that could also put upward pressure on yields.
Although the deterioration in the U.S. budget deficit may be capturing the headlines, other major countries are facing budgetary woes in coming years.
US, UK and eurozone real yields surged
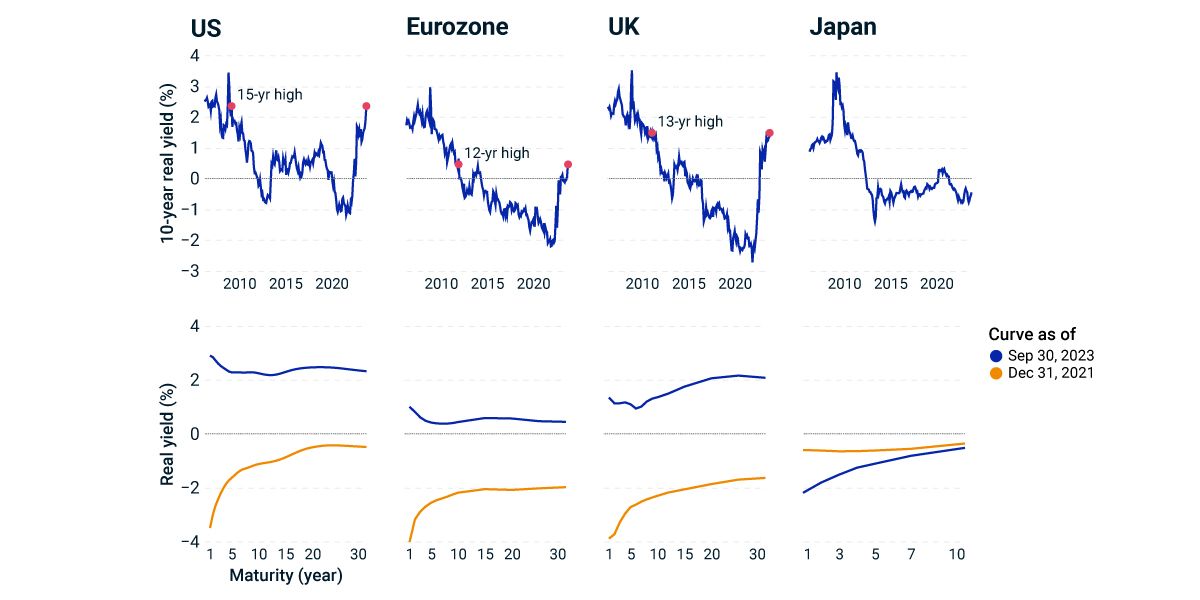
U.S. represented by the 10-year Treasury’s real yield. Eurozone represented by the 10-year German bund’s real yield supplemented by eurozone inflation swaps. U.K. represented by the 10-year U.K. gilt’s real yield. Japan represented by the 10-year Japanese government bond’s real yield. We have added 0.7% to the U.K. real rate to reflect the average difference between the retail price index and consumer price index. Data is from March 2006 through October 2023.


Subscribe todayto have insights delivered to your inbox.
Macro Scenarios in Focus: Higher Rates for Longer
How could higher global rates for longer than expected affect a global portfolio of equities, bonds and real estate? In our new quarterly series, Macro Scenarios in Focus, we consider four potential paths for the global economy and conduct a portfolio stress test.
Markets in Focus: Narrow Yield Spread and High Crowding Pressure Equities
Eclipsing equity and bond yields and high crowding may be signs of a vulnerable equity market. We compare equity/bond yield spreads in the major regional markets along with crowding in sectors and regions.
Bond Performance in 2023: A Midsummer Reflection
The good news for bond investors is that year-to-date U.S. returns have been positive. But bond returns were not as good compared to inflation, and bonds have continued to lag equities.
The content of this page is for informational purposes only and is intended for institutional professionals with the analytical resources and tools necessary to interpret any performance information. Nothing herein is intended to recommend any product, tool or service. For all references to laws, rules or regulations, please note that the information is provided “as is” and does not constitute legal advice or any binding interpretation. Any approach to comply with regulatory or policy initiatives should be discussed with your own legal counsel and/or the relevant competent authority, as needed.