
Buyout marks hold, but not for every asset
Chart • August 4, 2026
In this chart
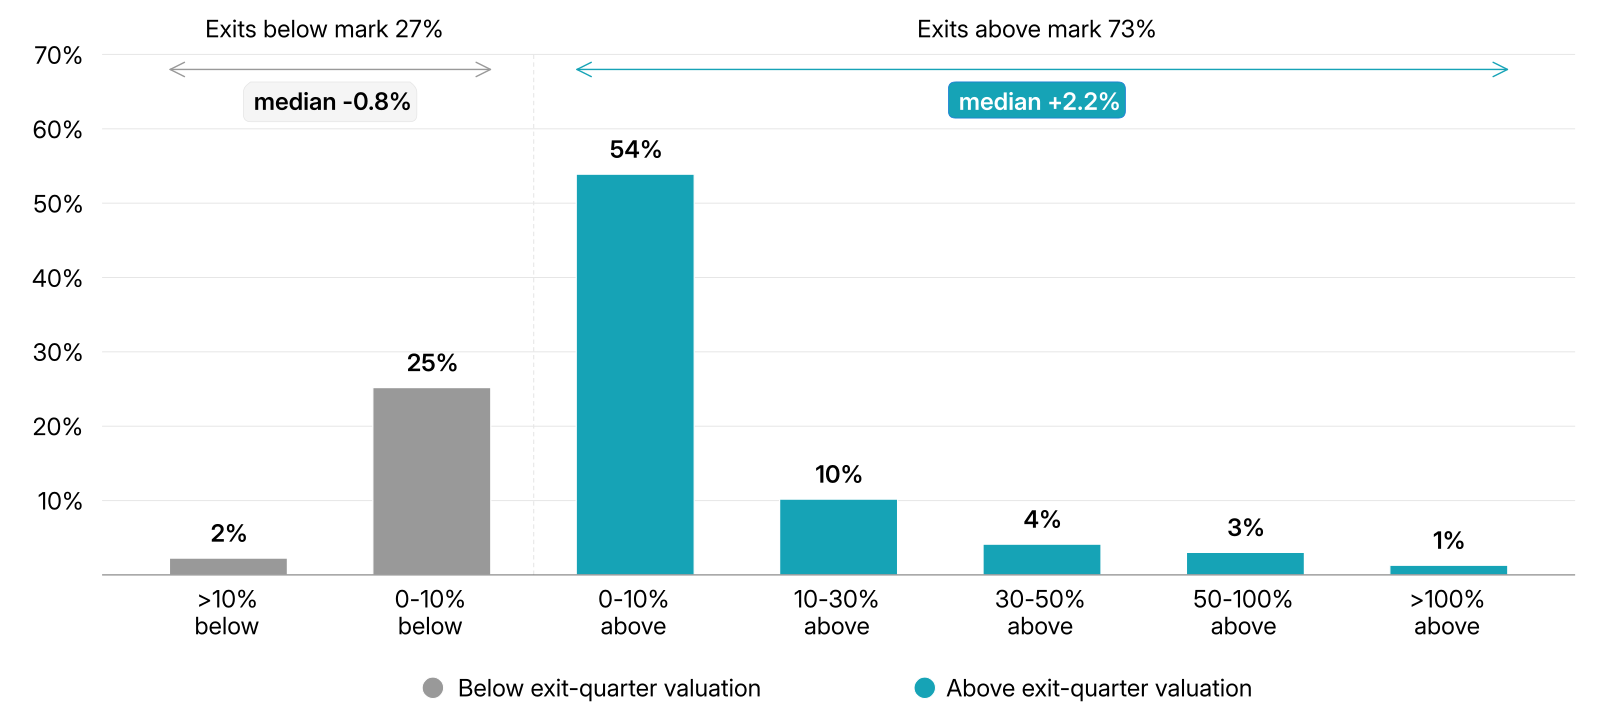
How much should limited partners trust the NAV a general partner reports on a buyout portfolio? Realized exits suggest the mark is more often a floor than a ceiling.Across global buyout deals from 2012 and 2025, nearly 75% of exits were priced above the valuation reported by the GP at the start of the exit quarter, according to the MSCI Private Capital Universe. The pattern persisted across market cycles, and most deviations were modest: The median above-mark exit exceeded the reported valuation by just over 2%, while the median below-mark exit fell short by less than 80 basis points.
This consistency makes NAV a useful reference point for asset owners assessing portfolio value. But the aggregate picture masks important variation. Using the valuation reported one quarter before exit as a cleaner benchmark, marks become less reliable as holding periods lengthen. Weaker investments are more likely to exit below their reported marks, stronger performers are more likely to exit above them – a pattern with direct implications for secondary pricing, NAV-based financing and manager evaluation.
For limited partners, the key takeaway is not simply that GPs mark conservatively on average, but that the reliability of those marks varies systematically by holding period and investment performance and those differences can be measured.
Source: MSCI Private Capital Universe. Global buyout funds, 2012–2025.