
The best exit pricing in a decade, and LPs are still waiting for cash
Chart • October 13, 2026
In this chart
Buyout exit multiples reached their highest level in nearly a decade in the first half of 2026. Top-quartile exits hit 18.2x EBITDA - the highest point in this data series back to 2016 - even as the median held broadly stable at 12.5x. The exit-to-entry spread, at roughly 1.2x, sits near its widest in several years, pointing to a supportive pricing environment for managers willing to transact.
The distribution data tells a different story. The distribution rate for buyout in H1 2026 was just 12%, down from 15% in 2025 and less than half of the historical average of around 27%. Net cash flows for buyout for the first half were USD +21 billion.
The gap between exit pricing and cash returned to LPs points to a structural issue that valuations alone cannot resolve. The problem, as the data makes clear, is not what assets are worth at exit, but the scarcity of exits themselves. Buyout exit multiples reaching a decade high should, in theory, be drawing more transactions to market, but in practice, the volume of realizations has not kept pace with the improvement in pricing.
For asset owners, the implication is that the distribution drought is unlikely to end simply because exit conditions have become more favorable. The pathway back to historical distribution levels runs through deal volume, not just deal pricing, and that requires a broader unlock in the transaction environment.
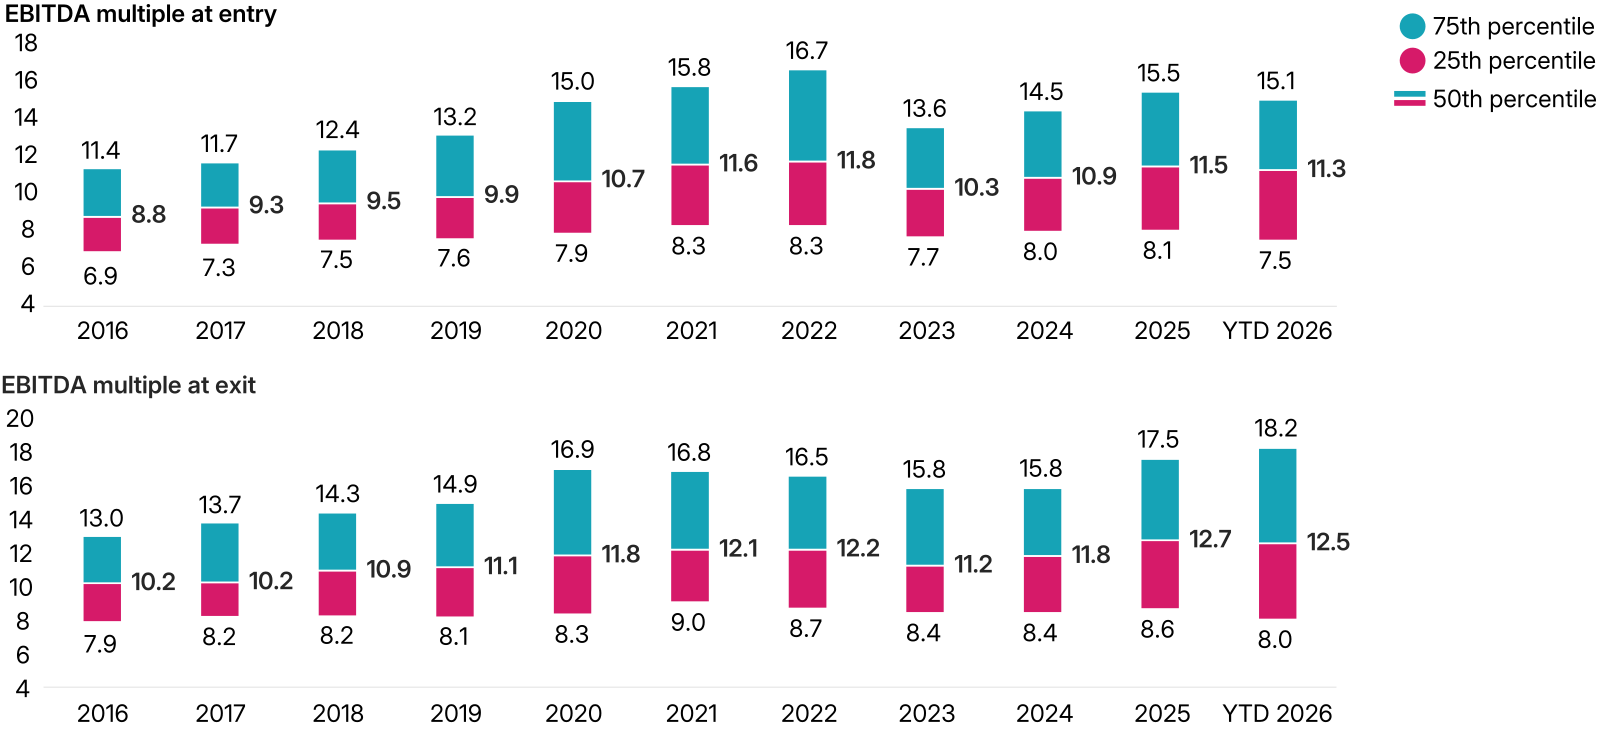
Source: MSCI Private Capital Benchmarks Summary Q2 2026. Data as of Q2 2026.