
MSCI Private Capital Benchmarks Summary Q2 2026
Preview
Venture capital took off in Q2 2026, benefiting from rising valuations among a handful of large, AI-linked companies. Returns in buyout came back to positive territory after a first-quarter blip, but without the same AI tailwinds, couldn’t keep pace with venture capital. Amid the brighter picture on returns, distributions remained constrained, however.
We examine these trends using data on more than 15,500 closed-end funds globally in the latest edition of our quarterly report.
Highlights:
- The quarterly return for venture capital reached 12.7% in Q2, the strongest showing for the asset class in five years. That helped lift the return for private equity to 5.6%, outpacing private credit and real assets.
- Private-equity net cash flow was slightly negative in H1, in contrast to a positive showing from private capital overall. The distribution rate slipped to 9%, extending the frustration of limited partners awaiting cash back.
- Returns in real assets were split, with real estate significantly surpassed by infrastructure and natural resources — asset classes that have been aided by commodity, energy-transition and AI-buildout drivers.
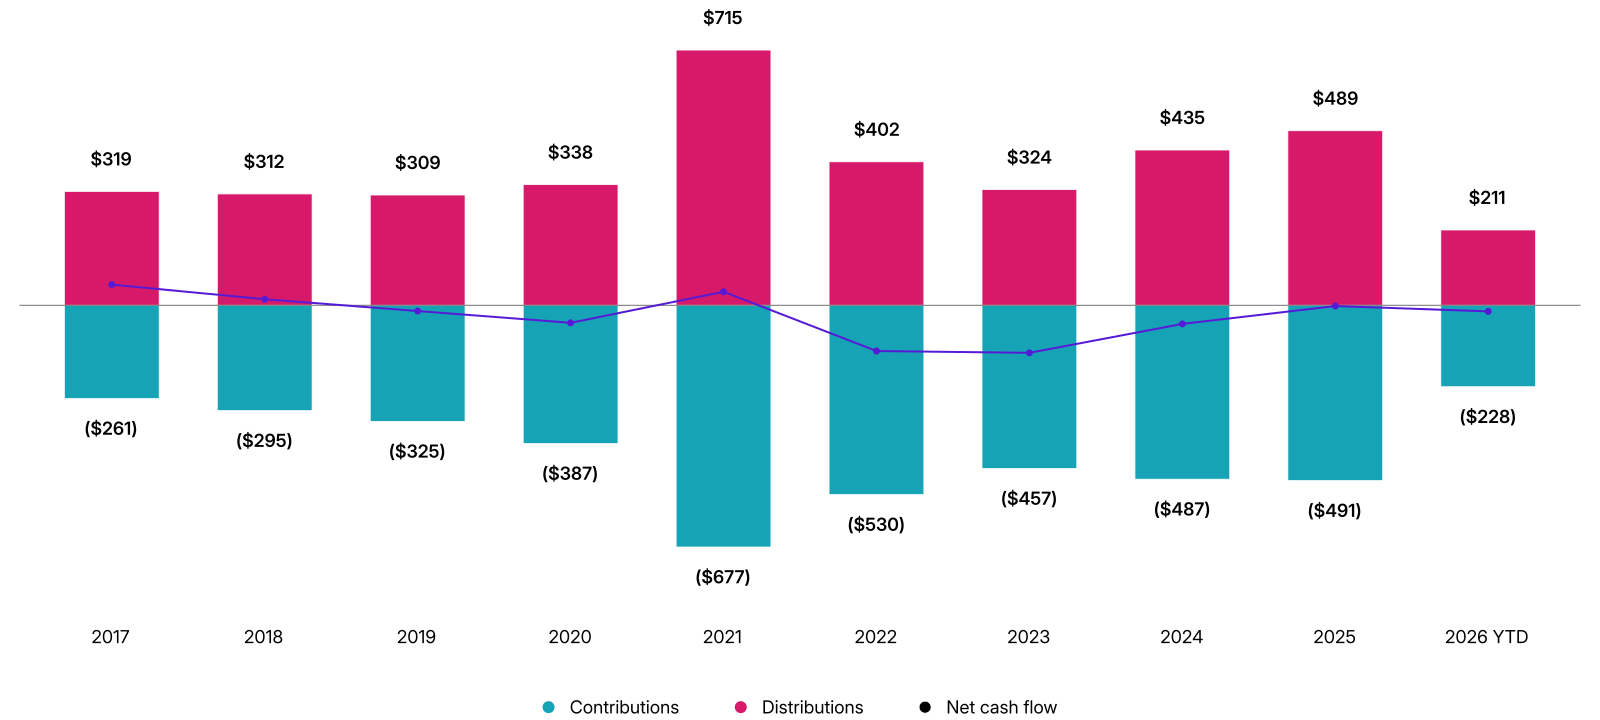
USD billion. Data as of Q2 2026 from the MSCI Private Capital Universe.



Read the full paper
Provide your information for instant access to our research papers.
MSCI Private Assets
Achieve greater transparency with our data, indexes and analytics for confident decision-making in private asset investing.
The Target Is Not the Benchmark
Private markets have scaled, but the standards used to judge them haven't. See why a CPI hurdle, a PME and a peer median all fall short of a real benchmark.
The Total Portfolio Approach: An Analytical Toolkit
This paper builds the cross-asset factor toolkit for a total portfolio approach that can show what asset-class labels miss — then puts it to work in a full portfolio walkthrough.
The content of this page is for informational purposes only and is intended for institutional professionals with the analytical resources and tools necessary to interpret any performance information. Nothing herein is intended to recommend any product, tool or service. For all references to laws, rules or regulations, please note that the information is provided “as is” and does not constitute legal advice or any binding interpretation. Any approach to comply with regulatory or policy initiatives should be discussed with your own legal counsel and/or the relevant competent authority, as needed.