A Mark to Market of European Real-Estate Collateral
Key findings
- European real-estate markets have suffered major price falls since their peaks in mid-2022. We estimate that 63% of the assets transacted since the beginning of 2017 experienced declines over the two years to Q2 2024.
- Lenders concerned about the impact on the value of their collateral should consider “since-transaction” price movement on an asset-by-asset basis. Only 55% of assets experienced price falls in this framework.
- Layering scenarios of loan-to-value (LTV) ratios onto the analysis allows lenders to consider which parts of their portfolios could be approaching LTV covenants or may struggle with refinancing in the current market.
Investment professionals in European commercial real estate are acutely aware of the broad weakening in prices since markets generally peaked, after the COVID-19 pandemic, in the summer of 2022. Some slices of the market, particularly offices, have experienced significant price falls since then, while others have continued to grow. Our analysis estimates that 63% of assets (by value) transacted since the beginning of 2017 registered negative price movements over the two years to Q2 2024.
The impact of recent price declines
The crucial question for lenders is what the price changes mean for their own pool of collateral. Taking a "since-transaction" perspective allows one to understand the extent to which recent price movements have negated or reversed prior price growth, or indeed compounded earlier negative trends.
We compare market-level price-index performance from Q1 2017 to Q2 2024, and also look at the two years since Q2 2022, when many markets' prices and values began to turn downward.
We also compare these index-level movements to since-transaction results that represent the aggregate change in estimated value of all assets in each market, from their individual transaction dates to Q2 2024. This number is driven by both index price performance as well as how transactions were spread over the period.[1]
Transaction timing matters for overall market change
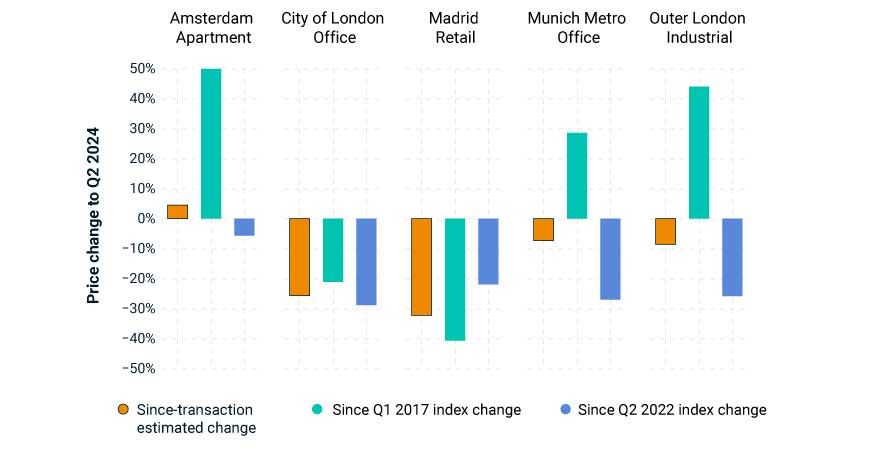
MSCI hedonic series pricing. Selected markets.
For instance, the office market in Munich posted a 27% fall in price since Q2 2022, but had enjoyed cumulative 29% growth from Q1 2017 to Q2 2024. The combination of the price performance profile with the way transactions were spread over that historical period means that the aggregate since-transaction price fall for all assets in this market segment is much more muted at 7.4%.
The same logic applied to Madrid yields a different result. The Madrid retail price index dropped 22% from Q2 2022 to Q2 2024, but prices had already fallen in the run-up to that period, yielding a cumulative drawdown of 40.7% since Q1 2017. However, the aggregate since-transaction drop in asset prices was only 32.3% given the spread of transactions since Q1 2017.
Such analysis may be particularly relevant to real-estate lenders trying to understand how recent price falls may impact current LTV ratios on their collateral. This need has become more pressing in the light of imminent banking regulations that mandate banks monitor their real-estate-loan portfolios on a regular basis using external market data.[2]
The potential impact on LTVs
To assess the potential impact on LTVs in Europe, we took all transactions over the last seven years and used the most relevant MSCI hedonic price index to mark to market each of these assets as of Q2 2024. Unlike the U.S., which benefits from high levels of loan-data disclosure, European debt markets are more opaque.[3] As such, to facilitate the analysis some assumptions are needed. In the scenario selection tool below, a user can choose an assumed origination LTV to apply to all assets in the portfolio, as well as a "troubled" LTV threshold. This threshold could be related to LTV covenants or be simply an LTV perceived to be a refinancing challenge in today's market.
The combination of these two LTV assumptions generates a price-movement threshold that is applied to the scatterplot to highlight "troubled" assets that have estimated since-transaction price falls below that threshold. The proportion of assets subject to this threshold are then summarized by property type in the bar chart.
A user can analyze three types of scenarios with the tool:
- Price falls
Select a cell in the grid where origination LTV equals the troubled-threshold LTV. This will produce a 0% price-change threshold that shows the proportion of assets whose prices have declined since their transaction date. - Tightening lending criteria
Select a realistic origination LTV with a lower troubled-threshold LTV. In this scenario, even assets that had enjoyed some price growth could be faced with refinancing risk. (These scenarios will result in higher proportions of assets deemed troubled in the bar chart.) - LTV covenant breach
Select a higher LTV threshold that could be associated with typical LTV covenants as a risk-monitoring process.[4] Assets with moderate price declines may not trigger the thresholds and a lower proportion of assets will be deemed troubled with this perspective.
Testing scenarios on LTVs
Loading chart...
Please wait.
How to use the interactive chart: Select a country from the dropdown menu. Next, select an LTV scenario by clicking a cell in the matrix to indicate an assumed start LTV and troubled LTV threshold. This combination will calculate a price-change threshold used to aggregate assets below the horizontal line displayed in the scatterplot. Estimated share of troubled assets is based on EUR value.
Consider a scenario in the U.K. for which we assume the same origination and troubled-threshold LTV. We find nearly 95% of office and 74% of retail properties transacted since 2017 experienced price declines versus their transacted prices. For industrial and apartment property, by contrast, the proportions were 40% and 18%, respectively.
In a scenario of tighter lending conditions — for example, assuming an origination LTV of 60% and a troubled LTV of 50% — the results become far more striking. Nearly 64% of U.K. apartment property, 76% of industrial and virtually all office and retail property could face refinancing difficulty as lenders would likely only be willing to provide a smaller proportion of asset financing.
A health check for collateral
By combining price indexes with assumed origination LTVs in various scenarios, our analysis illustrates how large swathes of property-loan collateral in Europe could be underwater or face refinancing struggles in the future. Using our tool, lenders can apply this same analysis to their own portfolios more precisely by using their own origination LTVs and closely mapped price indexes to understand better the health of their collateral pool and align with emerging regulatory requirements.


Subscribe todayto have insights delivered to your inbox.
1 Markets with more transactions at peak pricing will suffer more than those that had more transactions during previous market troughs and experienced significant price increases before the latest market downturn.2 Capital Requirements Regulation III, or CRR III, which will come into force in January 2025.3 Although more opaque, recent developments such as the launch of the MSCI Europe Quarterly Real Estate Debt Fund Index are starting to improve transparency.4 LTV covenants are typically set higher than origination LTVs at a loan level. The lender is protected by the borrower's equity cushion, but a covenant is put in place to help the lender monitor and protect this cushion.
The content of this page is for informational purposes only and is intended for institutional professionals with the analytical resources and tools necessary to interpret any performance information. Nothing herein is intended to recommend any product, tool or service. For all references to laws, rules or regulations, please note that the information is provided “as is” and does not constitute legal advice or any binding interpretation. Any approach to comply with regulatory or policy initiatives should be discussed with your own legal counsel and/or the relevant competent authority, as needed.