Climate Indexes Brought Short-Term Gloom with Blooming Offshoots
- MSCI ACWI climate indexes underperformed the MSCI ACWI Index in the first half of 2022, but historically outperformed from Nov. 29, 2013, to Dec. 31, 2021.
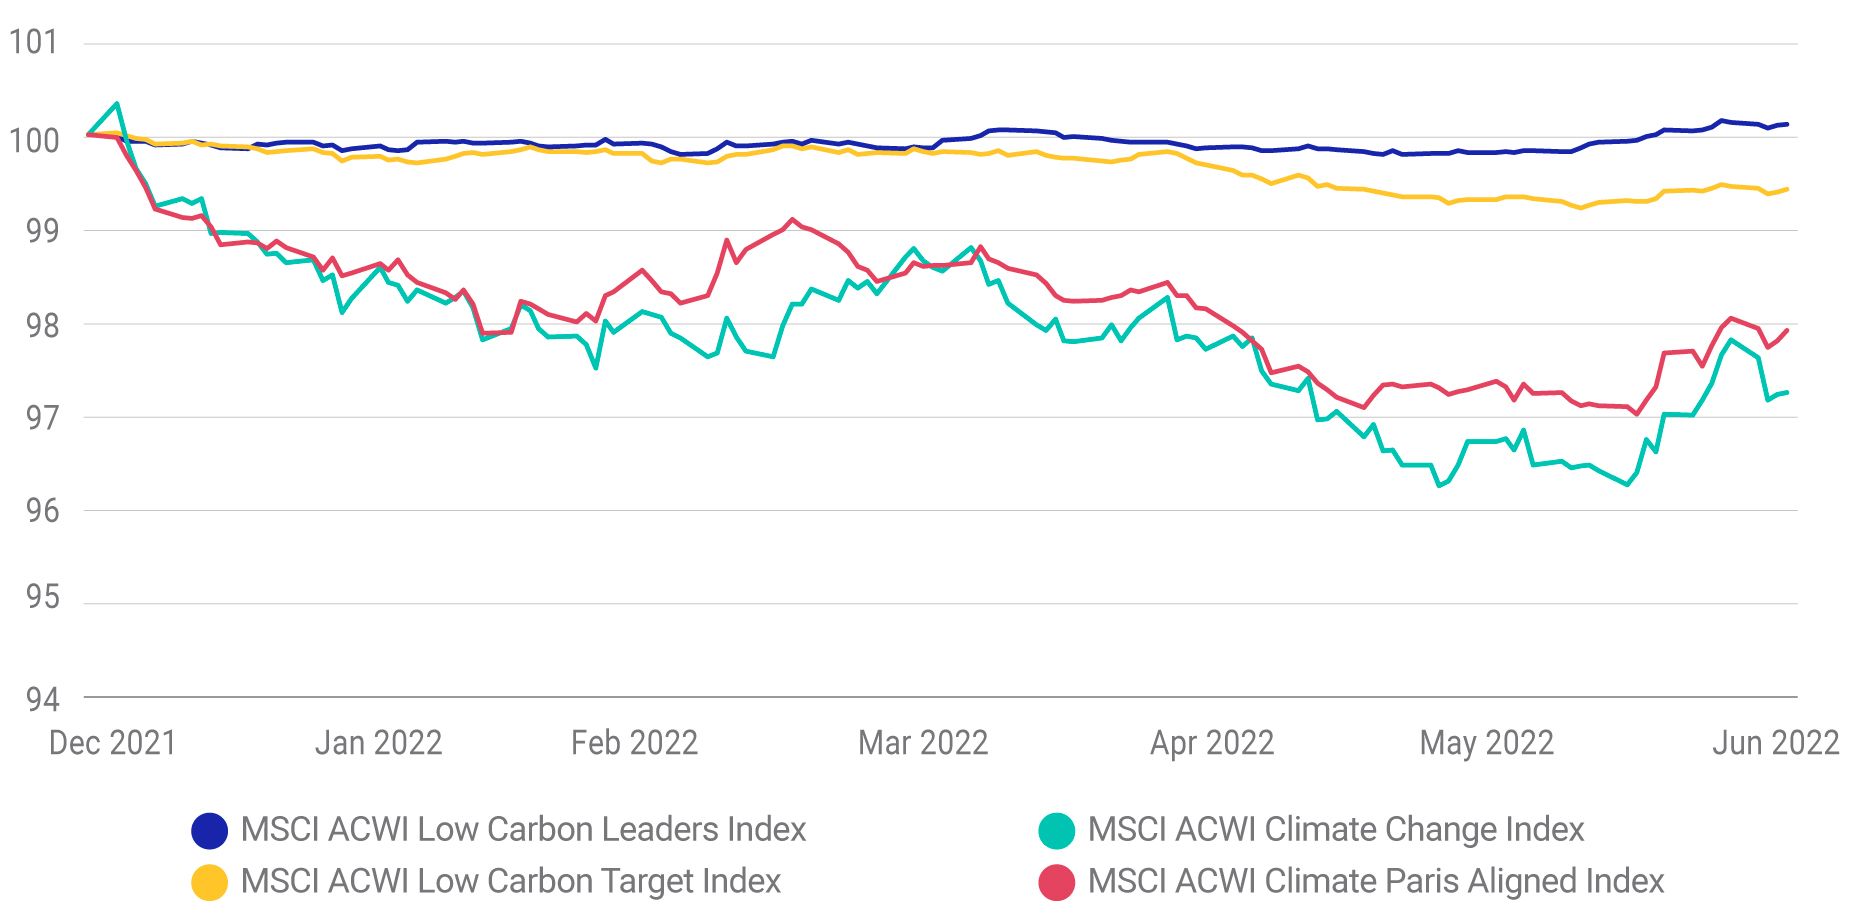
- This year's underperformance has primarily been driven by the outperformance of the energy sector as well as the rally in value stocks, although the contribution from green-revenue companies was helpful.
- MSCI climate indexes, which incorporate objectives aligned with climate change and the Paris Agreement, continued to have a robust climate profile and meet their climate objectives.
None | MSCI ACWI Index | MSCI ACWI Low Carbon Leaders Index | MSCI ACWI Low Carbon Target Index | MSCI ACWI Climate Change Index | MSCI ACWI Climate Paris Aligned Index |
Total return (%) | 10.7 | 10.8 | 10.8 | 12.0 | 12.0 |
Total risk (%) | 13.5 | 13.5 | 13.6 | 13.5 | 13.5 |
Return / Risk (%) | 0.79 | 0.80 | 0.80 | 0.89 | 0.89 |
Sharpe ratio | 0.74 | 0.74 | 0.74 | 0.84 | 0.84 |
Active return (%) | 0.0 | 0.1 | 0.1 | 1.3 | 1.2 |
Tracking error (%) | 0.0 | 0.4 | 0.4 | 1.2 | 1.0 |
Information ratio | None | 0.20 | 0.25 | 1.06 | 1.26 |
None | Average | Current |
Value | -0.03 | -0.12 |
Size | 0.01 | 0.02 |
Momentum | 0.03 | -0.12 |
Volatility | 0.00 | 0.10 |
Quality | 0.00 | 0.00 |
Yield | -0.05 | -0.11 |
Growth | 0.03 | 0.09 |
Liquidity | 0.00 | 0.03 |
None | Average | Current |
Value | -0.05 | -0.11 |
Size | -0.13 | -0.09 |
Momentum | 0.00 | -0.10 |
Volatility | -0.05 | -0.02 |
Quality | -0.02 | -0.03 |
Yield | -0.07 | -0.09 |
Growth | 0.00 | 0.01 |
Liquidity | 0.02 | -0.02 |
None | Average | Current |
Energy | -4.8 | -4.2 |
Materials | -1.7 | -1.8 |
Industrials | 0.06 | -0.2 |
Consumer discretionary | 0.1 | 2.3 |
Consumer staples | -0.3 | -1.1 |
Health care | 1.0 | 1.1 |
Financials | 2.0 | -1.3 |
Information technology | 3.8 | 5.9 |
Communication services | 0.4 | -0.3 |
Utilities | -1.3 | -0.9 |
Real estate | 0.2 | 0.6 |
None | Average | Current |
Energy | -5.5 | -4.9 |
Materials | -1.7 | -1.8 |
Industrials | 4.4 | 3.5 |
Consumer discretionary | -0.9 | -0.7 |
Consumer staples | -1.3 | -3.4 |
Health care | 0.5 | 0.9 |
Financials | 2.5 | 1.7 |
Information technology | 1.6 | 4.2 |
Communication services | -0.3 | -1.4 |
Utilities | -0.6 | -0.1 |
Real estate | 1.4 | 1.8 |
None | ACWI Climate Change Index | ACWI Climate Paris Aligned Index |
Risk indexes | 0.16 | 0.12 |
(FaCS value factor) | -0.05 | -0.07 |
Industry | 0.64 | 0.44 |
Country | 0.05 | 0.00 |
Currency | 0.02 | -0.11 |
Specific | 0.38 | 0.81 |
None | None | None |
Total active return | 1.25 | 1.26 |
None | ACWI Climate Change Index | ACWI Climate Paris Aligned Index |
Risk indexes | -1.48 | -0.59 |
(FaCS value factor) | -0.62 | -0.47 |
Industry | -1.61 | -1.65 |
(Oil-related industries)* | -0.95 | -1.11 |
Country | 0.12 | -0.02 |
Currency | 0.17 | 0.01 |
Specific | 0.61 | 0.59 |
None | None | None |
Total active return | -2.19 | -1.66 |
*Includes contributions from integrated oil and gas, oil and gas and consumable fuels & oil and gas exploration and production industry factors.

Subscribe todayto have insights delivered to your inbox.
The content of this page is for informational purposes only and is intended for institutional professionals with the analytical resources and tools necessary to interpret any performance information. Nothing herein is intended to recommend any product, tool or service. For all references to laws, rules or regulations, please note that the information is provided “as is” and does not constitute legal advice or any binding interpretation. Any approach to comply with regulatory or policy initiatives should be discussed with your own legal counsel and/or the relevant competent authority, as needed.