
Climate Indexes in Focus: Industry Positioning and Stock Selection Drove Performance Spreads
- Over the 12 months to June 2026, the MSCI ACWI Index returned 24.2%. Only the MSCI ACWI Climate Change CTB Index outperformed by 1.19%. Climate Paris Aligned PAB and Climate Action lagged most, by 5.04% and 3.92%.
- All Climate Indexes were underweight capital goods, which returned 33% and was a key source of relative underperformance.
- For investors comparing MSCI ACWI Climate Indexes, the AI build-out favored hardware over software, making differences in technology positioning an important driver of relative returns.
Mentioned in this blog post:
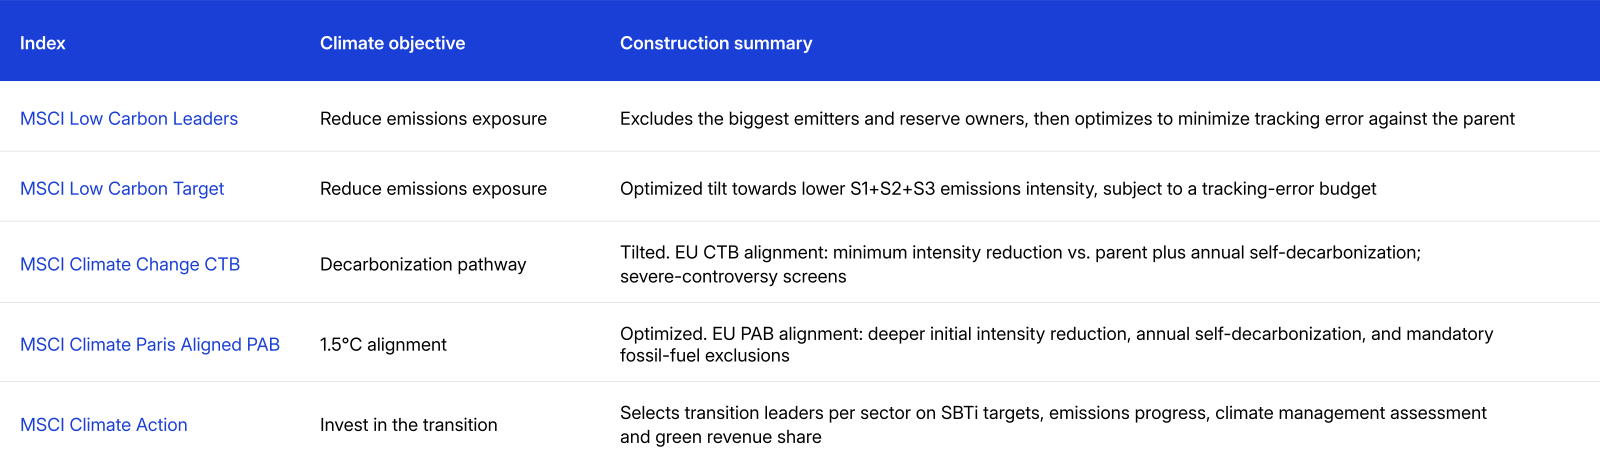
MSCI ACWI Climate Indexes reduce exposure to the market’s most emissions-intensive industries, and that positioning was a direct driver of performance against the parent over the period from June 2025 to June 2026. They did so alongside an AI trade that rewarded chipmakers, hardware and software unevenly, and rewarded individual companies within each category unevenly too. Two indexes aligned with the EU decarbonization frameworks ended up on opposite sides of performance, a result both of where each index was positioned by industry and which specific stocks it held.
Four of the five Climate Indexes underperformed the parent over the 12 months, a weaker showing than the Sustainability family delivered over the same window. Both Low Carbon Leaders and Low Carbon Target indexes delivered low tracking error but underperformed the MSCI ACWI Index by 31 bps and 184 bps, respectively. The Climate Action Index also underperformed by 3.92%.
The widest gap in the study opened between the two EU decarbonization indexes. The MSCI ACWI Climate Change CTB Index outperformed by 1.19% with a 2.99% tracking error (TE). The MSCI ACWI Climate Paris Aligned PAB Index, which follows the same decarbonization pathway to a deeper threshold, underperformed by 5.04% with 2.49% TE.
Each index met its climate objective, with Low Carbon Target and Climate Paris Aligned PAB providing the steepest reduction in carbon intensity (measured by Scope 1+2+3 carbon emissions relative to EVIC).1 Climate Action is the intended outlier: it carries the highest intensity of the five (181.7 tCO2e/USD mn) because it selects transition-ready companies rather than low emitters.
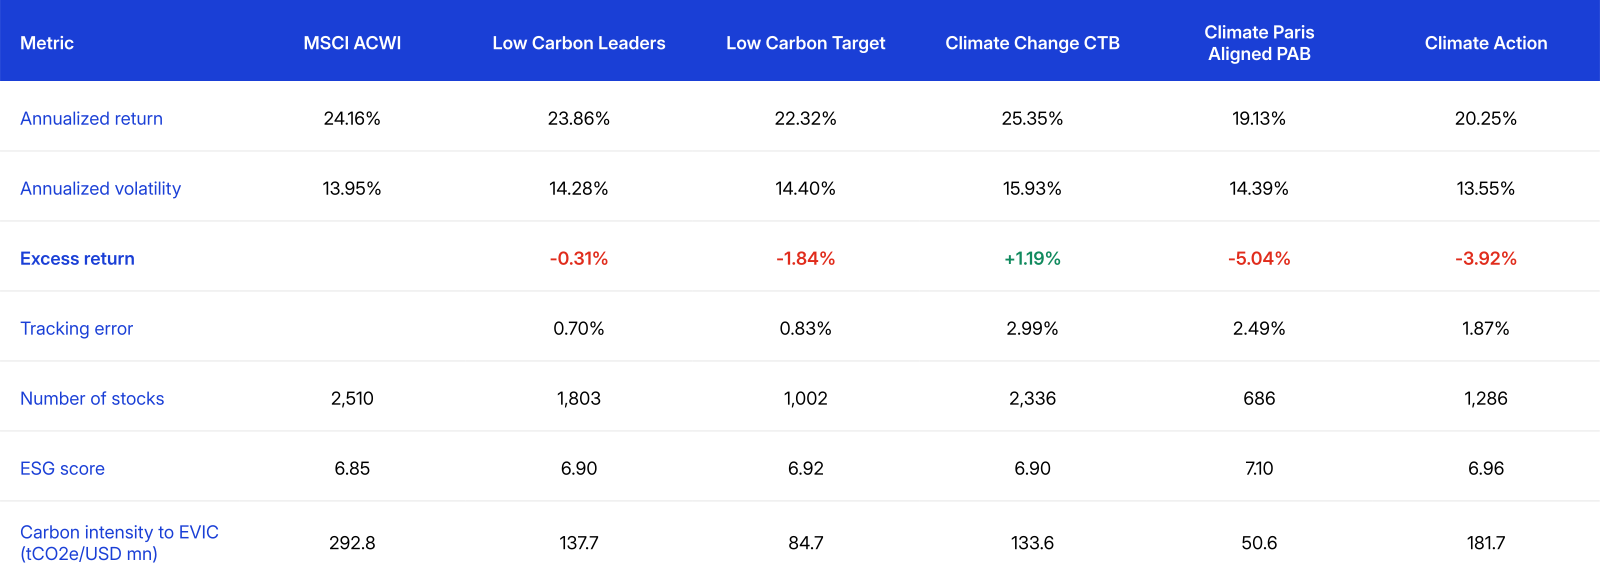
Data from June 30, 2025, to June 30, 2026. Returns in USD, gross. Carbon intensity measured as Scope 1+2+3 emissions relative to enterprise value including cash (EVIC).
None of the five MSCI ACWI Climate Indexes constrain industry exposure directly. Whether an index tilts toward lower emissions, optimizes to a tracking-error budget, or selects transition leaders within each sector, industry positions arise as a by-product of the climate criteria rather than as a deliberate choice.
Every index was underweight capital goods, which is what a carbon objective implies for one of the most emissions-intensive industry groups in the parent. Capital goods returned 33% over these 12 months, which led to the performance drag of all Climate Indexes. Technology explained almost all of the performance dispersion.
The MSCI ACWI Climate Change CTB Index gained in both semiconductors and technology hardware; the MSCI ACWI Climate Action Index lost in both and was the only index across MSCI’s Sustainability and Climate Indexes with a negative semiconductor contribution despite an overweight position. Net exposure was not enough: Returns within semiconductors were widely dispersed, so security selection drove outcomes as much as company weights did.
The MSCI ACWI Climate Paris Aligned PAB Index exemplifies this point: the index held technology hardware at close to benchmark weight and still lost 1.43% there, so the shortfall came from company selection within the sector, not an under- or over-allocation to it. Software and services, where it was overweight, cost a further 1.30%. A deep decarbonization target, among other elements of the methodology, can leave large under- or over-exposures within an industry as well as across industries, and in this period, both sat on the wrong side of the AI trade.
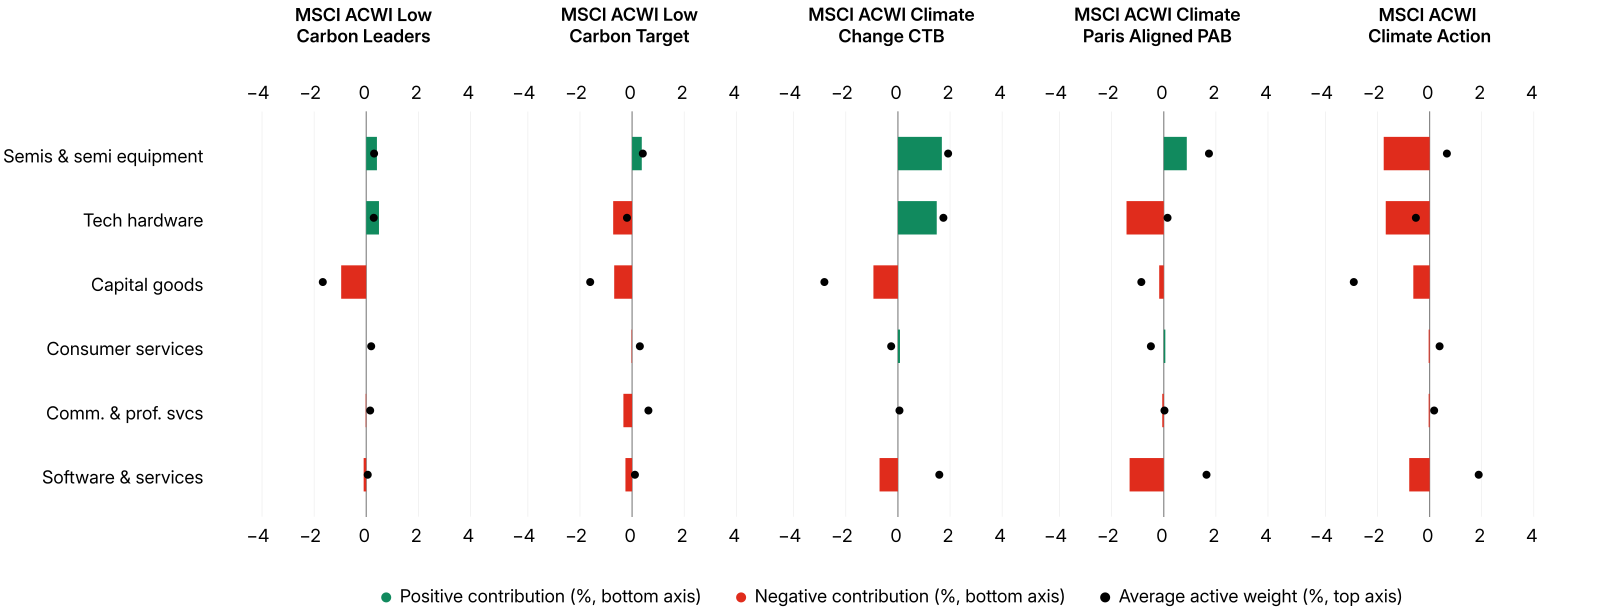
Data from June 30, 2025, to June 30, 2026. Returns in USD, gross. The chart shows the active exposure to the three best- and three worst-performing Global Industry Classification Standard (GICS®)2 industry groups in the MSCI ACWI Index over the period, selected by industry-group return, and the aggregate active performance from the securities from those industry groups.
The chart below shows each index’s constituents from largest to smallest, showing where overweight and underweight positions contributed to or detracted from performance. MSCI ACWI Climate Change CTB’s overweights in a slew of mega-caps — NVIDIA, Apple, Amazon, Alphabet, Broadcom, TSMC and Tesla — contributed 2.24% to active return on their own, nearly double the index’s eventual +1.19% result. The rest of the portfolio gave back roughly half of that gain.
MSCI ACWI Climate Paris Aligned PAB mega-caps told a different story: NVIDIA, Apple, Amazon, TSMC and Tesla added only slim gains. Underweights in Samsung Electronics, Micron, Caterpillar and SK Hynix then erased what was left within the same stretch and pulled performance firmly negative.
Data from June 30, 2025, to June 30, 2026. Returns in USD, gross.
How to use this chart: Click on the individual index name to see the returns over the time period. Hover over each dot in the chart to see the active weight and performance contribution of each security named.
This year’s climate index performance was both an industry story and a stock-specific one. Climate Change CTB and Climate Paris Aligned held largely the same mega-caps, yet landed on opposite sides of performance — proof that as an index’s eligible universe narrows, individual holdings matter as much as the tilt built around them.



Subscribe todayto have insights delivered to your inbox.
Climate Indexes
MSCI builds equity and fixed income climate indexes to help investors seeking to measure and manage climate risk and identify additional investment opportunities.
Climate Action: Performance and Decarbonization Insights
The MSCI Climate Action Indexes enable climate-aware investors to align their portfolios with real-world decarbonization without sacrificing strong returns.
Climate and ESG Indexes in Focus: Sectors Told the Story
We review the drivers of performance for ESG and climate indexes over the first quarter of 2023, and investigate the explanatory power of the carbon-efficiency factor over time.
1 The climate objective of each index, and the considerations behind selecting one over another, are explained in our previous research: Understanding MSCI Climate Indexes, September 2024.
2 GICS is the industry-classification standard jointly developed by MSCI and S&P Dow Jones Indices.
The content of this page is for informational purposes only and is intended for institutional professionals with the analytical resources and tools necessary to interpret any performance information. Nothing herein is intended to recommend any product, tool or service. For all references to laws, rules or regulations, please note that the information is provided “as is” and does not constitute legal advice or any binding interpretation. Any approach to comply with regulatory or policy initiatives should be discussed with your own legal counsel and/or the relevant competent authority, as needed.