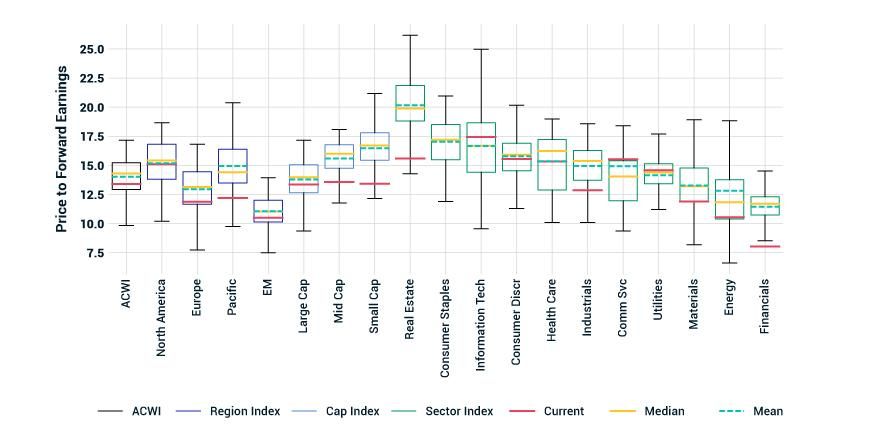
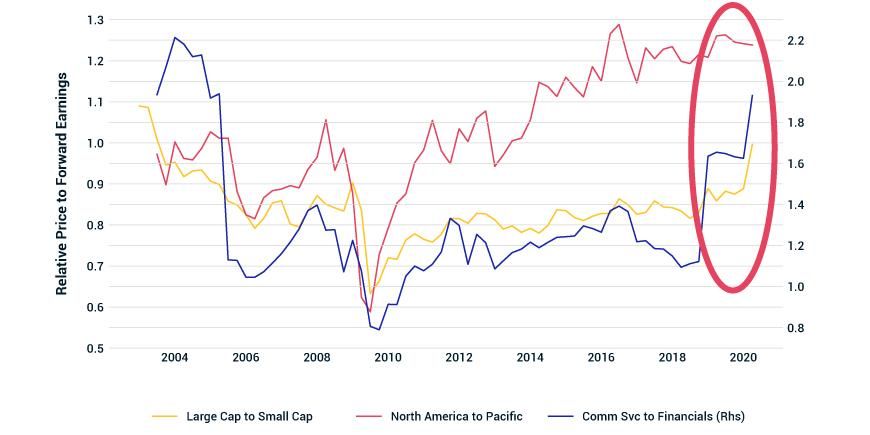
- During turbulent market environments, dislocations may sometimes happen in equity markets and market segments, including geographies, market-cap size and sectors.
- Index-level prices, along with fundamental data, could help investors identify potential dislocations in market performance.
- Currency-hedged indexes could help identify potential dislocations in a strategic currency-overlay policy.
None | 1D | 1W | 1M | 3M | MYD | QTD | YTD | 1 Yr | 3 Yr | 5 Yr | 10 Yr |
MSCI China A Onshore IMI Index | 0.8 | 1.5 | -1.0 | -3.2 | -1.0 | 5.2 | -3.6 | 5.6 | -1.6 | -10.4 | 3.5 |
MSCI China IMI Index | 1.5 | 2.3 | -0.6 | -1.4 | -0.6 | 5.7 | -5.2 | 11.3 | 5.6 | 1.5 | 5.5 |
MSCI USA IMI Index | 0.5 | 3.1 | 5.4 | 3.0 | 5.4 | 19.4 | -5.6 | 10.3 | 9.5 | 9.2 | 12.9 |
MSCI Japan IMI Index | -09 | 5.6 | 6.2 | 4.4 | 6.2 | 12.1 | -7.2 | 6.1 | 3.7 | 3.9 | 6.5 |
MSCI World IMI Index | 0.0 | 3.8 | 5.1 | 0.5 | 5.1 | 17.0 | -8.8 | 5.3 | 5.9 | 6.1 | 9.8 |
MSCI ACWI IMI Index | 0.0 | 3.7 | 4.7 | -0.4 | 4.7 | 16.2 | -9.7 | 4.2 | 5.2 | 5.5 | 9.0 |
MSCI EM Asia IMI Index | 1.0 | 2.7 | -0.1 | -4.0 | -0.1 | 9.6 | -11.1 | 3.0 | 1.4 | 1.9 | 5.2 |
MSCI AC Asia ex Japan IMI Index | 0.8 | 2.4 | -0.9 | -5.3 | -0.9 | 8.5 | -12.2 | -0.3 | 0.9 | 1.4 | 5.2 |
MSCI EAFE IMI Index | -0.9 | 5.2 | 4.8 | -3.3 | 4.8 | 12.2 | -14.0 | -2.7 | 0.3 | 1.6 | 6.0 |
MSCI World Small Cap Index | -0.1 | 4.4 | 7.1 | -3.6 | 7.1 | 21.5 | -14.9 | -2.7 | 2.0 | 4.0 | 9.1 |
MSCI USA Cap Index | -0.2 | 3.6 | 7.2 | -4.8 | 7.2 | 23.1 | -15.4 | -4.3 | 3.1 | 4.6 | 10.4 |
MSCI Europe IMI Index | -0.8 | 5.3 | 4.9 | -5.1 | 4.9 | 12.0 | -16.1 | -4.1 | -1.0 | 0.9 | 6.1 |
MSCI EM IMI Index | 0.5 | 2.8 | 0.9 | -7.2 | 0.9 | 10.7 | -16.3 | -3.7 | -0.6 | 0.7 | 2.8 |
MSCI FM IMI Index | 0.3 | 2.6 | 5.3 | -12.0 | 5.3 | 12.4 | -16.9 | -11.8 | -3.4 | -0.4 | None |
MSCI Europe Small Cap Index | 0.0 | 6.6 | 6.9 | -6.5 | 6.9 | 18.9 | -17.3 | -2.6 | -0.9 | 2.7 | 9.0 |
MSCI EM Small Cap Index | -0.1 | 2.6 | 2.4 | -10.2 | 2.4 | 16.7 | -19.9 | -11.7 | -5.0 | -3.7 | 1.4 |
MSCI EMEA IMI Index | -1.5 | 1.3 | 3.6 | -9.6 | 3.6 | 15.0 | -24.1 | -14.7 | -5.7 | -2.8 | -0.7 |
MSCI EM Latin America IMI Index | -0.9 | 6.5 | 6.4 | -26.8 | 6.4 | 13.5 | -39.0 | -30.3 | -8.5 | -3.6 | -4.1 |


Subscribe todayto have insights delivered to your inbox.
The content of this page is for informational purposes only and is intended for institutional professionals with the analytical resources and tools necessary to interpret any performance information. Nothing herein is intended to recommend any product, tool or service. For all references to laws, rules or regulations, please note that the information is provided “as is” and does not constitute legal advice or any binding interpretation. Any approach to comply with regulatory or policy initiatives should be discussed with your own legal counsel and/or the relevant competent authority, as needed.