ESG Indexes Lifted by Carbon-Efficient Firms but Underperformed
- MSCI ACWI ESG Indexes outperformed on an annual basis for most years between 2013 and 2021 but underperformed during the first three quarters of 2022.
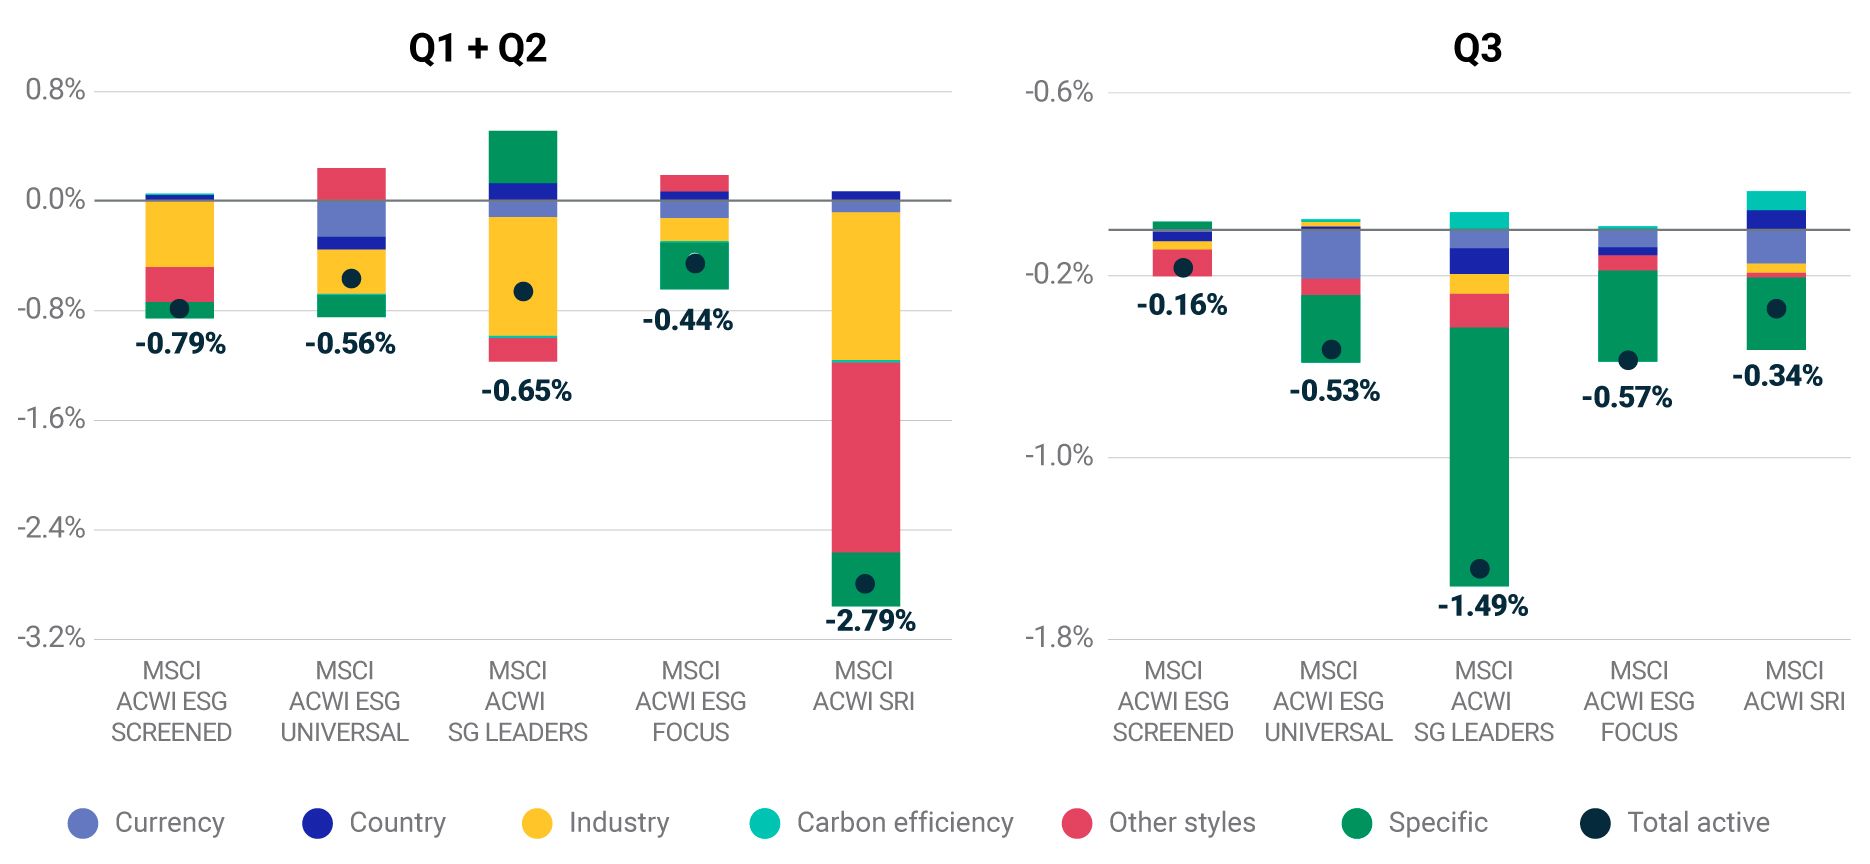
- While allocations to carbon-efficient companies within each sector contributed to performance, exclusions from the MSCI ACWI ESG Leaders Index due to ongoing ESG controversies detracted from performance.
- The third quarter was characterized by change of direction in the performance of industry factors, especially energy and aerospace and defense. This led to reducing the industry contribution of the MSCI ACWI ESG Indexes.
None | MSCI ACWI Index | MSCI ACWI ESG Screened Index | MSCI ACWI ESG Universal Index | MSCI ACWI ESG Leaders Index | MSCI ACWI ESG Focus Index | MSCI ACWI SRI Index |
Q3 | -6.8 | -7.0 | -7.3 | -8.3 | -7.4 | -7.2 |
YTD | -25.6 | -26.5 | -26.6 | -27.4 | -26.5 | -28.5 |
2021 | 19.0 | 19.2 | 20.5 | 21.3 | 18.8 | 24.5 |
2020 | 16.8 | 18.4 | 17.8 | 16.6 | 19.2 | 21.4 |
2019 | 27.3 | 27.8 | 28.7 | 27.9 | 28.2 | 29.2 |
2018 | -8.9 | -8.9 | -8.8 | -8.1 | -8.2 | -6.5 |
2017 | 24.6 | 24.8 | 24.8 | 23.8 | 25.2 | 25.4 |
2016 | 8.5 | 8.0 | 7.8 | 8.5 | 9.4 | 8.9 |
2015 | -1.8 | -1.1 | -1.2 | -1.7 | -1.0 | -2.2 |
2014 | 4.7 | 5.1 | 4.8 | 5.4 | 5.1 | 4.5 |
2013 | 23.4 | 24.3 | 25.5 | 25.1 | 24.2 | 24.6 |
Asset Name | Constituent of MSCI ACWI ESG Leaders in Q3 | Average parent weight, Q3 | Average active weight in MSCI ACWI ESG Leaders, Q3 | Cumulative asset return Q3 | Cumulative specific return contribution MSCI ACWI ESG Leaders Q3 |
APPLE INC | No | 4.44% | -4.44% | 1.22% | -0.15% |
MICROSOFT CORP | Yes | 3.28% | 3.26% | -9.12% | -0.20% |
AMAZON.COM INC | No | 2.01% | -2.01% | 6.39% | -0.10% |
ALPHABET INC | Yes | 2.27% | 2.25% | -12.22% | -0.15% |
Unnamed: 0 | Unnamed: 1 | Unnamed: 2 | Unnamed: 3 | Sign of average exposure Q3, 2022 | Sign of average exposure Q3, 2022.1 | Sign of average exposure Q3, 2022.2 | Sign of average exposure Q3, 2022.3 | Sign of average exposure Q3, 2022.4 |
|---|---|---|---|---|---|---|---|---|
Unnamed: 0 None | Unnamed: 1 Industry factors | Unnamed: 2 Performance Q3, 2022 | Unnamed: 3 Performance Q1 + Q2, 2022 | Sign of average exposure Q3, 2022 MSCI ACWI ESG SCREENED | Sign of average exposure Q3, 2022.1 MSCI ACWI ESG UNIVERSAL | Sign of average exposure Q3, 2022.2 MSCI ACWI ESG LEADERS | Sign of average exposure Q3, 2022.3 MSCI ACWI ESG FOCUS | Sign of average exposure Q3, 2022.4 MSCI ACWI SRI |
Unnamed: 0 Top Q3 | Unnamed: 1 IT Services and Software | Unnamed: 2 0.71% | Unnamed: 3 -4.31% | Sign of average exposure Q3, 2022 + | Sign of average exposure Q3, 2022.1 + | Sign of average exposure Q3, 2022.2 + | Sign of average exposure Q3, 2022.3 degrees | Sign of average exposure Q3, 2022.4 + |
Unnamed: 0 Top Q3 | Unnamed: 1 Pharmaceuticals and Life Sciences | Unnamed: 2 0.47% | Unnamed: 3 3.82% | Sign of average exposure Q3, 2022 degrees | Sign of average exposure Q3, 2022.1 - | Sign of average exposure Q3, 2022.2 + | Sign of average exposure Q3, 2022.3 degrees | Sign of average exposure Q3, 2022.4 - |
Unnamed: 0 Top Q3 | Unnamed: 1 Computers and Electronics | Unnamed: 2 0.39% | Unnamed: 3 -7.79% | Sign of average exposure Q3, 2022 degrees | Sign of average exposure Q3, 2022.1 degrees | Sign of average exposure Q3, 2022.2 - | Sign of average exposure Q3, 2022.3 degrees | Sign of average exposure Q3, 2022.4 - |
Unnamed: 0 Top Q3 | Unnamed: 1 Banks | Unnamed: 2 0.36% | Unnamed: 3 1.81% | Sign of average exposure Q3, 2022 degrees | Sign of average exposure Q3, 2022.1 degrees | Sign of average exposure Q3, 2022.2 - | Sign of average exposure Q3, 2022.3 degrees | Sign of average exposure Q3, 2022.4 - |
Unnamed: 0 Top Q3 | Unnamed: 1 Capital Markets | Unnamed: 2 0.30% | Unnamed: 3 -7.99% | Sign of average exposure Q3, 2022 degrees | Sign of average exposure Q3, 2022.1 degrees | Sign of average exposure Q3, 2022.2 degrees | Sign of average exposure Q3, 2022.3 degrees | Sign of average exposure Q3, 2022.4 - |
Unnamed: 0 Top Q3 | Unnamed: 1 Retailing | Unnamed: 2 0.30% | Unnamed: 3 -7.08% | Sign of average exposure Q3, 2022 degrees | Sign of average exposure Q3, 2022.1 degrees | Sign of average exposure Q3, 2022.2 + | Sign of average exposure Q3, 2022.3 degrees | Sign of average exposure Q3, 2022.4 + |
Unnamed: 0 Bottom Q3 | Unnamed: 1 Oil and Gas and Consumable Fuels | Unnamed: 2 -0.24% | Unnamed: 3 39.71% | Sign of average exposure Q3, 2022 degrees | Sign of average exposure Q3, 2022.1 degrees | Sign of average exposure Q3, 2022.2 degrees | Sign of average exposure Q3, 2022.3 degrees | Sign of average exposure Q3, 2022.4 degrees |
Unnamed: 0 Bottom Q3 | Unnamed: 1 Food and Beverage and Tobacco | Unnamed: 2 -0.43% | Unnamed: 3 7.38% | Sign of average exposure Q3, 2022 degrees | Sign of average exposure Q3, 2022.1 + | Sign of average exposure Q3, 2022.2 - | Sign of average exposure Q3, 2022.3 degrees | Sign of average exposure Q3, 2022.4 + |
Unnamed: 0 Bottom Q3 | Unnamed: 1 Integrated Oil and Gas | Unnamed: 2 -0.73% | Unnamed: 3 25.05% | Sign of average exposure Q3, 2022 - | Sign of average exposure Q3, 2022.1 - | Sign of average exposure Q3, 2022.2 - | Sign of average exposure Q3, 2022.3 degrees | Sign of average exposure Q3, 2022.4 - |
Unnamed: 0 Bottom Q3 | Unnamed: 1 Aerospace and Defense | Unnamed: 2 -1.04% | Unnamed: 3 20.40% | Sign of average exposure Q3, 2022 - | Sign of average exposure Q3, 2022.1 - | Sign of average exposure Q3, 2022.2 - | Sign of average exposure Q3, 2022.3 degrees | Sign of average exposure Q3, 2022.4 - |
Unnamed: 0 Bottom Q3 | Unnamed: 1 Utilities | Unnamed: 2 -1.37% | Unnamed: 3 7.09% | Sign of average exposure Q3, 2022 - | Sign of average exposure Q3, 2022.1 degrees | Sign of average exposure Q3, 2022.2 - | Sign of average exposure Q3, 2022.3 degrees | Sign of average exposure Q3, 2022.4 - |
Unnamed: 0 Bottom Q3 | Unnamed: 1 Oil and Gas Exploration and Production | Unnamed: 2 -1.65% | Unnamed: 3 57.43% | Sign of average exposure Q3, 2022 - | Sign of average exposure Q3, 2022.1 degrees | Sign of average exposure Q3, 2022.2 - | Sign of average exposure Q3, 2022.3 degrees | Sign of average exposure Q3, 2022.4 - |
Unnamed: 0 and Q2 Top Q1 | Unnamed: 1 Oil and Gas Exploration and Production | Unnamed: 2 -1.65% | Unnamed: 3 57.43% | Sign of average exposure Q3, 2022 - | Sign of average exposure Q3, 2022.1 degrees | Sign of average exposure Q3, 2022.2 - | Sign of average exposure Q3, 2022.3 degrees | Sign of average exposure Q3, 2022.4 - |
Unnamed: 0 and Q2 Top Q1 | Unnamed: 1 Integrated Oil and Gas | Unnamed: 2 -0.73% | Unnamed: 3 25.05% | Sign of average exposure Q3, 2022 - | Sign of average exposure Q3, 2022.1 - | Sign of average exposure Q3, 2022.2 - | Sign of average exposure Q3, 2022.3 degrees | Sign of average exposure Q3, 2022.4 - |
Unnamed: 0 and Q2 Top Q1 | Unnamed: 1 Aerospace and Defense | Unnamed: 2 -1.04% | Unnamed: 3 20.40% | Sign of average exposure Q3, 2022 - | Sign of average exposure Q3, 2022.1 - | Sign of average exposure Q3, 2022.2 - | Sign of average exposure Q3, 2022.3 degrees | Sign of average exposure Q3, 2022.4 - |
Unnamed: 0 and Q2 Top Q1 | Unnamed: 1 None | Unnamed: 2 None | Unnamed: 3 None | Sign of average exposure Q3, 2022 None | Sign of average exposure Q3, 2022.1 None | Sign of average exposure Q3, 2022.2 None | Sign of average exposure Q3, 2022.3 None | Sign of average exposure Q3, 2022.4 None |
Unnamed: 0 and Q2 Top Q1 | Unnamed: 1 None | Unnamed: 2 None | Unnamed: 3 None | Sign of average exposure Q3, 2022 None | Sign of average exposure Q3, 2022.1 None | Sign of average exposure Q3, 2022.2 None | Sign of average exposure Q3, 2022.3 None | Sign of average exposure Q3, 2022.4 None |
Unnamed: 0 and Q2 Top Q1 | Unnamed: 1 None | Unnamed: 2 None | Unnamed: 3 None | Sign of average exposure Q3, 2022 None | Sign of average exposure Q3, 2022.1 None | Sign of average exposure Q3, 2022.2 None | Sign of average exposure Q3, 2022.3 None | Sign of average exposure Q3, 2022.4 None |


Subscribe todayto have insights delivered to your inbox.
The content of this page is for informational purposes only and is intended for institutional professionals with the analytical resources and tools necessary to interpret any performance information. Nothing herein is intended to recommend any product, tool or service. For all references to laws, rules or regulations, please note that the information is provided “as is” and does not constitute legal advice or any binding interpretation. Any approach to comply with regulatory or policy initiatives should be discussed with your own legal counsel and/or the relevant competent authority, as needed.