MSCI ESG Indexes during the coronavirus crisis
- We compared four global MSCI ESG indexes to their parent indexes during the COVID-19 sell-off as well as for longer periods.
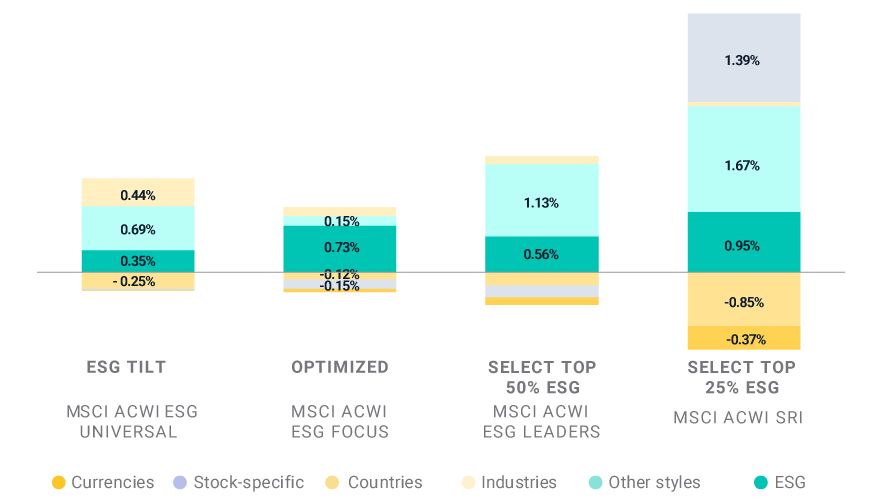
- MSCI's GEM Model with an ESG factor shows that a large part of the indexes' Q1 2020 performance was attributable to the systematic tilt of these indexes toward higher ESG-rated stocks, similar to what we observed over the past five years.
- A number of regional and sub-regional ESG indexes outperformed their market-cap-weighted parent index during Q1 2020 though some approaches underperformed in emerging markets.
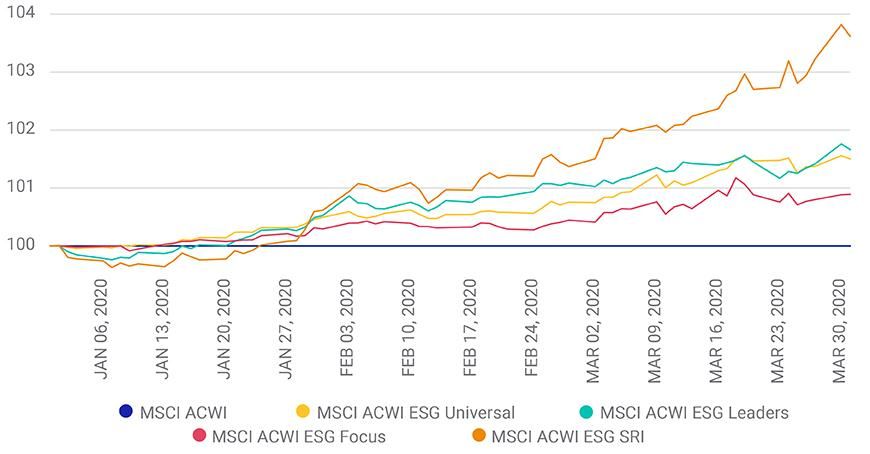
Performance (%) | Performance (%).1 | Performance (%).2 | Performance (%).3 | Performance (%).4 | Performance (%).5 |
|---|---|---|---|---|---|
Performance (%) None | Performance (%).1 MSCI ACWI | Performance (%).2 MSCI ACWI ESG Universal | Performance (%).3 MSCI ACWI ESG Focus | Performance (%).4 MSCI ACWI ESG Leaders | Performance (%).5 MSCI ACWI SRI |
Performance (%) YTD | Performance (%).1 -21.3 | Performance (%).2 -20.1 | Performance (%).3 -20.6 | Performance (%).4 -19.9 | Performance (%).5 -18.4 |
Performance (%) 1 Yr | Performance (%).1 -10.7 | Performance (%).2 -8.4 | Performance (%).3 -9.2 | Performance (%).4 -8.5 | Performance (%).5 -5.2 |
Performance (%) 3 Yr | Performance (%).1 2.0 | Performance (%).2 3.0 | Performance (%).3 3.0 | Performance (%).4 3.0 | Performance (%).5 4.9 |
Performance (%) 5 Yr | Performance (%).1 3.4 | Performance (%).2 4.0 | Performance (%).3 4.3 | Performance (%).4 3.9 | Performance (%).5 5.1 |
Source of Return | MSCI ACWI ESG Universal | MSCI ACWI ESG Focus | MSCI ACWI ESG Leaders | MSCI ACWI SRI |
|---|---|---|---|---|
Source of Return Styles | MSCI ACWI ESG Universal 1.04% | MSCI ACWI ESG Focus 0.88% | MSCI ACWI ESG Leaders 1.70% | MSCI ACWI SRI 2.61% |
Source of Return ESG | MSCI ACWI ESG Universal 0.35% | MSCI ACWI ESG Focus 0.73% | MSCI ACWI ESG Leaders 0.56% | MSCI ACWI SRI 0.95% |
Source of Return Beta | MSCI ACWI ESG Universal 0.09% | MSCI ACWI ESG Focus -0.04% | MSCI ACWI ESG Leaders 0.36% | MSCI ACWI SRI 0.45% |
Source of Return Profitability | MSCI ACWI ESG Universal 0.07% | MSCI ACWI ESG Focus 0.04% | MSCI ACWI ESG Leaders 0.16% | MSCI ACWI SRI 0.21% |
Source of Return Residual volatility | MSCI ACWI ESG Universal 0.11% | MSCI ACWI ESG Focus 0.14% | MSCI ACWI ESG Leaders 0.13% | MSCI ACWI SRI 0.07% |
Source of Return Leverage | MSCI ACWI ESG Universal 0.09% | MSCI ACWI ESG Focus -0.01% | MSCI ACWI ESG Leaders 0.11% | MSCI ACWI SRI 0.17% |
Source of Return Momentum | MSCI ACWI ESG Universal 0.10% | MSCI ACWI ESG Focus 0.07% | MSCI ACWI ESG Leaders 0.09% | MSCI ACWI SRI 0.24% |
Source of Return Dividend yield | MSCI ACWI ESG Universal 0.07% | MSCI ACWI ESG Focus -0.02% | MSCI ACWI ESG Leaders 0.07% | MSCI ACWI SRI 0.17% |
Source of Return Liquidity | MSCI ACWI ESG Universal 0.02% | MSCI ACWI ESG Focus -0.01% | MSCI ACWI ESG Leaders 0.06% | MSCI ACWI SRI 0.05% |
Source of Return Book-to-price | MSCI ACWI ESG Universal 0.03% | MSCI ACWI ESG Focus 0.00% | MSCI ACWI ESG Leaders 0.06% | MSCI ACWI SRI 0.07% |
Source of Return Earnings yield | MSCI ACWI ESG Universal 0.04% | MSCI ACWI ESG Focus 0.00% | MSCI ACWI ESG Leaders 0.05% | MSCI ACWI SRI 0.07% |
Source of Return Size | MSCI ACWI ESG Universal 0.07% | MSCI ACWI ESG Focus -0.01% | MSCI ACWI ESG Leaders 0.03% | MSCI ACWI SRI 0.13% |
Source of Return Earnings quality | MSCI ACWI ESG Universal 0.01% | MSCI ACWI ESG Focus 0.00% | MSCI ACWI ESG Leaders 0.01% | MSCI ACWI SRI 0.00% |
Source of Return Mid capitalization | MSCI ACWI ESG Universal 0.01% | MSCI ACWI ESG Focus 0.00% | MSCI ACWI ESG Leaders 0.01% | MSCI ACWI SRI 0.02% |
Source of Return Long-Term reversal | MSCI ACWI ESG Universal -0.02% | MSCI ACWI ESG Focus -0.01% | MSCI ACWI ESG Leaders 0.01% | MSCI ACWI SRI -0.01% |
Source of Return Investment quality | MSCI ACWI ESG Universal 0.00% | MSCI ACWI ESG Focus 0.00% | MSCI ACWI ESG Leaders 0.01% | MSCI ACWI SRI 0.03% |
Source of Return Growth | MSCI ACWI ESG Universal 0.00% | MSCI ACWI ESG Focus 0.01% | MSCI ACWI ESG Leaders 0.00% | MSCI ACWI SRI 0.00% |
Source of Return Earnings variability | MSCI ACWI ESG Universal 0.00% | MSCI ACWI ESG Focus 0.00% | MSCI ACWI ESG Leaders -0.01% | MSCI ACWI SRI -0.01% |
('Unnamed: 0_level_0', 'Source of Return') | ('ESG Tilt', 'MSCI ACWI ESG Universal') | ('Optimized', 'MSCI ACWI ESG Focus') | ('Select Top 50% ESG', 'MSCI ACWI ESG Leaders') | ('Select Top 25% ESG', 'MSCI ACWI SRI') |
|---|---|---|---|---|
('Unnamed: 0_level_0', 'Source of Return') Total active | ('ESG Tilt', 'MSCI ACWI ESG Universal') 0.89% | ('Optimized', 'MSCI ACWI ESG Focus') 1.04% | ('Select Top 50% ESG', 'MSCI ACWI ESG Leaders') 0.49% | ('Select Top 25% ESG', 'MSCI ACWI SRI') 1.68% |
('Unnamed: 0_level_0', 'Source of Return') ESG | ('ESG Tilt', 'MSCI ACWI ESG Universal') 0.19% | ('Optimized', 'MSCI ACWI ESG Focus') 0.86% | ('Select Top 50% ESG', 'MSCI ACWI ESG Leaders') 0.27% | ('Select Top 25% ESG', 'MSCI ACWI SRI') 0.47% |
('Unnamed: 0_level_0', 'Source of Return') Other styles | ('ESG Tilt', 'MSCI ACWI ESG Universal') 0.42% | ('Optimized', 'MSCI ACWI ESG Focus') 0.35% | ('Select Top 50% ESG', 'MSCI ACWI ESG Leaders') 0.51% | ('Select Top 25% ESG', 'MSCI ACWI SRI') 0.95% |
('Unnamed: 0_level_0', 'Source of Return') Industries | ('ESG Tilt', 'MSCI ACWI ESG Universal') 0.20% | ('Optimized', 'MSCI ACWI ESG Focus') 0.12% | ('Select Top 50% ESG', 'MSCI ACWI ESG Leaders') 0.00% | ('Select Top 25% ESG', 'MSCI ACWI SRI') -0.02% |
('Unnamed: 0_level_0', 'Source of Return') Countries | ('ESG Tilt', 'MSCI ACWI ESG Universal') -0.09% | ('Optimized', 'MSCI ACWI ESG Focus') -0.07% | ('Select Top 50% ESG', 'MSCI ACWI ESG Leaders') -0.03% | ('Select Top 25% ESG', 'MSCI ACWI SRI') -0.19% |
('Unnamed: 0_level_0', 'Source of Return') Stock-specific | ('ESG Tilt', 'MSCI ACWI ESG Universal') 0.27% | ('Optimized', 'MSCI ACWI ESG Focus') -0.17% | ('Select Top 50% ESG', 'MSCI ACWI ESG Leaders') -0.23% | ('Select Top 25% ESG', 'MSCI ACWI SRI') 0.58% |
('Unnamed: 0_level_0', 'Source of Return') Currencies | ('ESG Tilt', 'MSCI ACWI ESG Universal') -0.11% | ('Optimized', 'MSCI ACWI ESG Focus') -0.06% | ('Select Top 50% ESG', 'MSCI ACWI ESG Leaders') -0.03% | ('Select Top 25% ESG', 'MSCI ACWI SRI') -0.11% |
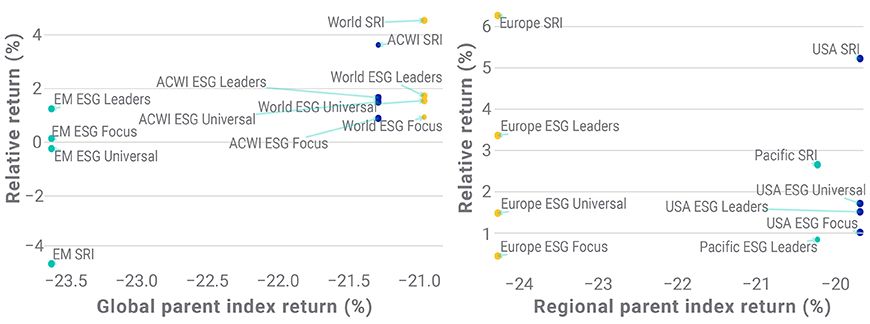
- In all DM regions, the SRI index showed the strongest outperformance, both because of its higher exposure to style factors that outperformed and because of its larger stock-specific contribution. A full-factor attribution (see below) shows that the performance contribution from equity style factors in aggregate and the ESG factor specifically was positive for all indexes.
- In EM, the underperformance of the ESG Universal and SRI indexes was due to unintended country and currency exposures, especially for the MSCI EM SRI Index. While the MSCI SRI Index methodology is constructed to mitigate active sector and active regional exposures by performing a best-in-class selection per the Global Industry Classification Standard (GICS®)2 sector and sub-region, there can be residual unintended country exposures, which in this case resulted in a negative contribution to performance. In the case of the MSCI EM SRI Index, the underweight in the China International market and the overweight in the South Africa market accounted for most of the negative country contribution.
Unnamed: 0 | Developed Markets | Developed Markets.1 | Developed Markets.2 | Developed Markets.3 | Developed Markets.4 | Developed Markets.5 | Developed Markets.6 | Developed Markets.7 | Developed Markets.8 | Developed Markets.9 |
|---|---|---|---|---|---|---|---|---|---|---|
Unnamed: 0 Source of Return | Developed Markets MSCI USA ESG Universal | Developed Markets.1 MSCI USA ESG Focus | Developed Markets.2 MSCI USA ESG Leaders | Developed Markets.3 MSCI USA SRI | Developed Markets.4 MSCI EUROPE ESG Universal | Developed Markets.5 MSCI EUROPE ESG Focus | Developed Markets.6 MSCI EUROPE ESG Leaders | Developed Markets.7 MSCI EUROPE SRI | Developed Markets.8 MSCI PACIFIC ESG Leaders | Developed Markets.9 MSCI PACIFIC SRI |
Unnamed: 0 Total active | Developed Markets 1.38% | Developed Markets.1 0.82% | Developed Markets.2 1.22% | Developed Markets.3 4.20% | Developed Markets.4 1.12% | Developed Markets.5 0.34% | Developed Markets.6 2.55% | Developed Markets.7 4.75% | Developed Markets.8 0.67% | Developed Markets.9 2.12% |
Unnamed: 0 ESG | Developed Markets 0.30% | Developed Markets.1 0.49% | Developed Markets.2 0.60% | Developed Markets.3 0.97% | Developed Markets.4 0.27% | Developed Markets.5 0.21% | Developed Markets.6 0.48% | Developed Markets.7 0.78% | Developed Markets.8 0.52% | Developed Markets.9 0.93% |
Unnamed: 0 Other styles | Developed Markets 0.58% | Developed Markets.1 0.00% | Developed Markets.2 1.02% | Developed Markets.3 1.02% | Developed Markets.4 0.72% | Developed Markets.5 0.06% | Developed Markets.6 1.02% | Developed Markets.7 2.17% | Developed Markets.8 1.36% | Developed Markets.9 2.00% |
Unnamed: 0 Industries | Developed Markets 0.46% | Developed Markets.1 0.24% | Developed Markets.2 0.10% | Developed Markets.3 -0.22% | Developed Markets.4 0.31% | Developed Markets.5 -0.08% | Developed Markets.6 0.02% | Developed Markets.7 0.00% | Developed Markets.8 0.32% | Developed Markets.9 0.75% |
Unnamed: 0 Countries | Developed Markets 0.00% | Developed Markets.1 -0.02% | Developed Markets.2 0.00% | Developed Markets.3 -0.09% | Developed Markets.4 0.10% | Developed Markets.5 -0.03% | Developed Markets.6 0.33% | Developed Markets.7 0.78% | Developed Markets.8 -1.06% | Developed Markets.9 -1.40% |
Unnamed: 0 Stock-specific | Developed Markets 0.05% | Developed Markets.1 0.11% | Developed Markets.2 -0.51% | Developed Markets.3 2.52% | Developed Markets.4 -0.28% | Developed Markets.5 0.22% | Developed Markets.6 0.63% | Developed Markets.7 0.80% | Developed Markets.8 0.35% | Developed Markets.9 1.05% |
Unnamed: 0 Currencies | Developed Markets 0.00% | Developed Markets.1 0.00% | Developed Markets.2 0.00% | Developed Markets.3 0.00% | Developed Markets.4 0.01% | Developed Markets.5 -0.04% | Developed Markets.6 0.06% | Developed Markets.7 0.20% | Developed Markets.8 -0.82% | Developed Markets.9 -1.22% |
Unnamed: 0 | Emerging Markets | Emerging Markets.1 | Emerging Markets.2 |
|---|---|---|---|
Unnamed: 0 Source of Return | Emerging Markets MSCI EM ESG Universal | Emerging Markets.1 MSCI EM ESG Leaders | Emerging Markets.2 MSCI EM SRI |
Unnamed: 0 Total active | Emerging Markets -0.18% | Emerging Markets.1 0.95% | Emerging Markets.2 -3.57% |
Unnamed: 0 ESG | Emerging Markets 0.27% | Emerging Markets.1 0.60% | Emerging Markets.2 1.03% |
Unnamed: 0 Other styles | Emerging Markets 0.78% | Emerging Markets.1 2.37% | Emerging Markets.2 4.83% |
Unnamed: 0 Industries | Emerging Markets 0.20% | Emerging Markets.1 0.26% | Emerging Markets.2 0.97% |
Unnamed: 0 Countries | Emerging Markets -0.53% | Emerging Markets.1 -1.21% | Emerging Markets.2 -5.92% |
Unnamed: 0 Stock-specific | Emerging Markets -0.52% | Emerging Markets.1 -0.43% | Emerging Markets.2 -1.24% |
Unnamed: 0 Currencies | Emerging Markets -0.11% | Emerging Markets.1 -0.04% | Emerging Markets.2 -2.21% |


Subscribe todayto have insights delivered to your inbox.
The analysis and observations in this report are limited solely to the period of the relevant historical data, backtest or simulation. Past performance — whether actual, backtested or simulated — is no indication or guarantee of future performance. None of the information or analysis herein is intended to constitute investment advice or a recommendation to make (or refrain from making) any kind of investment decision or asset allocation and should not be relied on as such.2GICS, the global industry classification standard jointly developed by MSCI and Standard & Poor’s.
The content of this page is for informational purposes only and is intended for institutional professionals with the analytical resources and tools necessary to interpret any performance information. Nothing herein is intended to recommend any product, tool or service. For all references to laws, rules or regulations, please note that the information is provided “as is” and does not constitute legal advice or any binding interpretation. Any approach to comply with regulatory or policy initiatives should be discussed with your own legal counsel and/or the relevant competent authority, as needed.