Evaluating Options in Different Macro and Volatility Regimes
- Equity markets have been volatile, given an inflation surge, growth uncertainty and war in Ukraine. Some investors have looked to option strategies to manage volatility and/or target alternative risk/return profiles.
- We evaluate the historical performance of systematic options-overlay strategies on equities: "buy-write," "put-write" (with Treasurys) and "put-protection" strategies, in various macro and volatility regimes.
- In "stagflation," buy-write and put-protection outperformed their respective benchmark indexes. In "heating up" periods, put-write with Treasurys outperformed a Treasury allocation (from March 31, 2006, to Jan. 31, 2022).
One-month implied and realized volatility for options linked to the MSCI EAFE and MSCI EM Indexes
Loading chart...
Please wait.
Data from Jan. 29,1990, to Feb. 28, 2022. Implied volatility is based on the average implied volatility of one-month 50-delta call and put options. Source: OptionMetrics
In previous volatile markets, some investors have looked to options strategies to manage volatility and/or target alternative risk/return profiles. In this blog post, we evaluate historical performance of systematic options-overlay strategies across various macro and volatilty regimes. To do so, we looked at a range of options-based strategies, outlined in the exhibit below.
Options strategies linked to MSCI EAFE and EM Indexes

*Out of the money. Due to the lack of sufficient historical data for options linked to the MSCI EAFE and MSCI EM Indexes, we used options linked to the iShares MSCI EAFE ETF and iShares MSCI Emerging Markets ETF, from March 31, 2006, to Aug. 17, 2018, and then used options linked to the MSCI indexes.
Options-strategy performance conditioned on macro environment
As shown in the exhibit below, the options strategies linked to the MSCI EAFE Index we analyzed had negative average monthly returns during the "stagflation" and "slow growth" periods between March 31, 2006, and Jan. 31, 2022, and positive returns in "heating up" and "goldilocks" scenarios.2 Options linked to the index provided downside protection in the "stagflation" and "slow growth" scenarios, offsetting the returns to the underlying equity index.
Strategies based on options linked to the MSCI EM Index also provided negative returns in the stagflation periods and slightly positive returns during slow growth. Options linked to the index provided downside protection in the stagflation periods and enhanced returns in slow growth.
Average monthly returns for options-linked strategies based on MSCI EAFE and MSCI EM Indexes
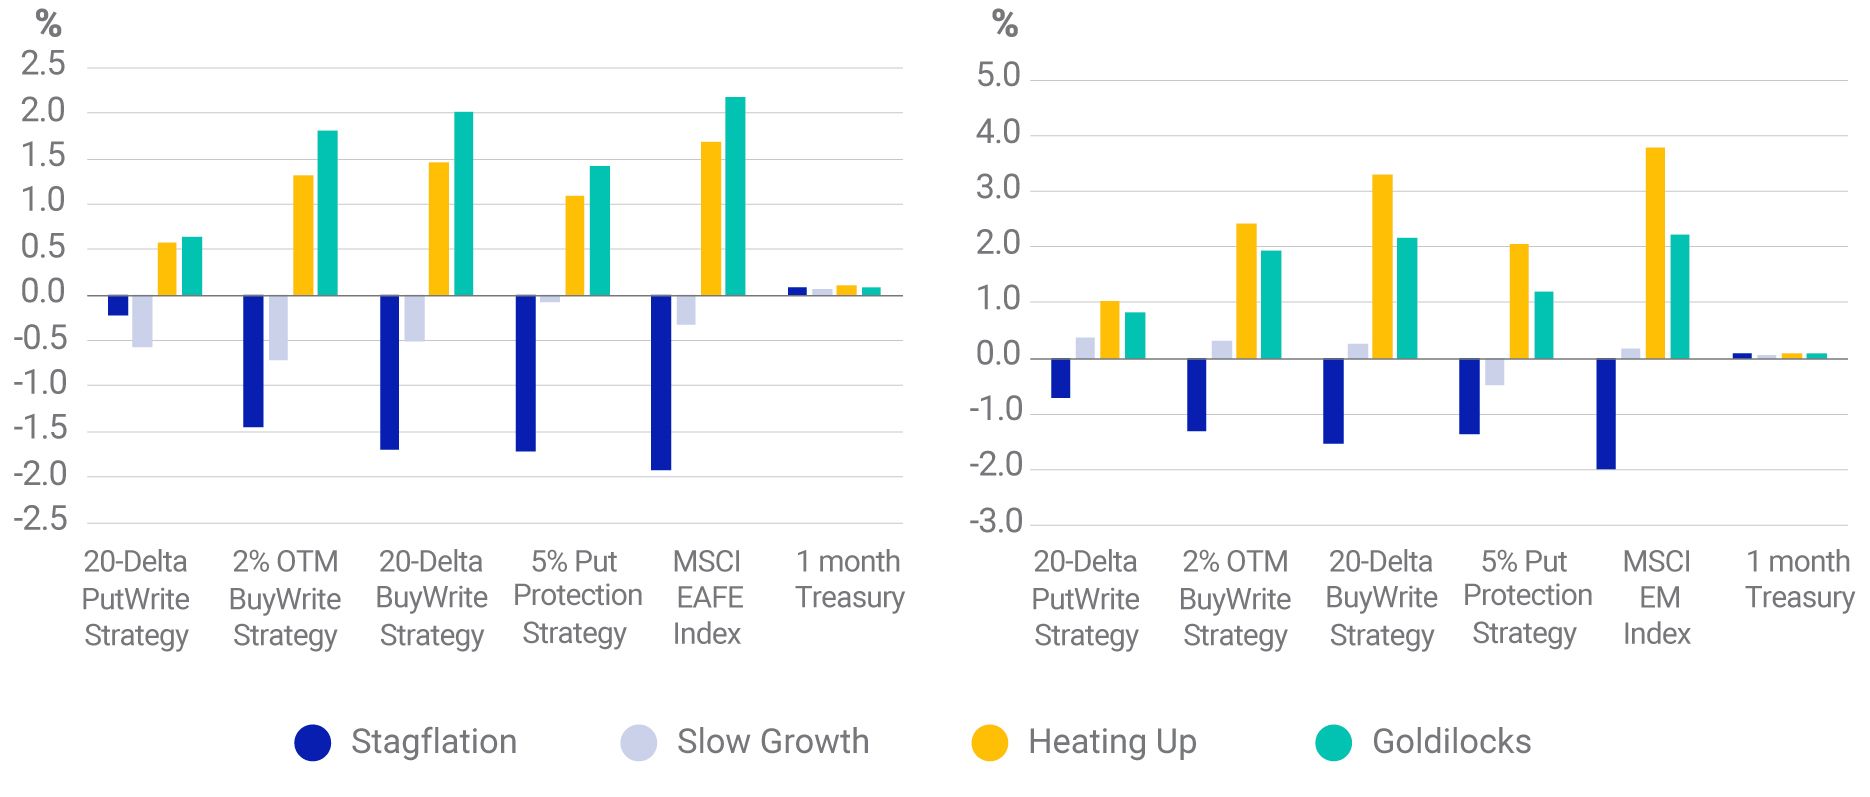
Data from March 31, 2006, to Jan. 31, 2022. Source: Cboe, Organization for Economic Cooperation and Development
Options-strategy performance conditioned on market volatility
We next compared the performance of the same option-linked strategies in different volatility environments. The volatility quintiles were calculated based on the annualized monthly historical volatility for the MSCI EAFE and MSCI EM Indexes.
Annualized returns for options-linked strategies based on MSCI EAFE and MSCI EM Indexes
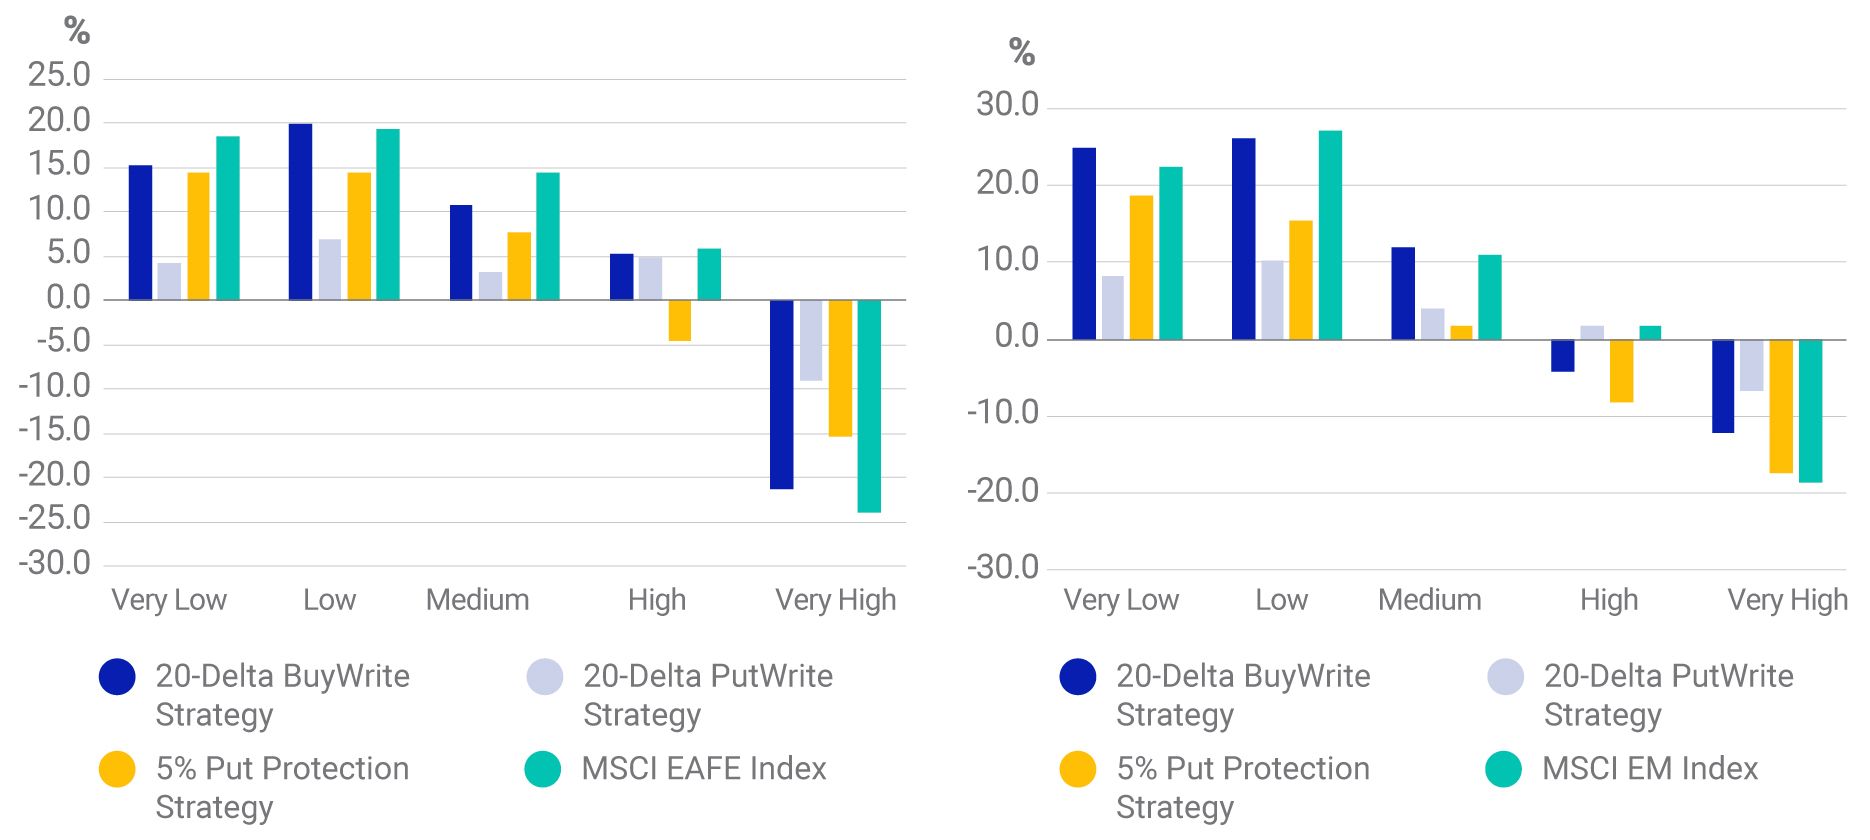
The buckets for strategies linked to the MSCI EAFE Index were generated using thresholds based on historical realized volatility data: [0,9.4,11.5,14.3,18.5,83.2]. The buckets for strategies linked to the MSCI EM Index were generated using thresholds based on historical realized volatility data: [0,10.5,12.8,15.2,19.7,95.2]. Data from March 31, 2006, to Jan. 31, 2022. Source: Cboe
As illustrated in the exhibit above, we saw similar trends for options linked to both indexes. In a "very high" volatility environment, the three options strategies outperformed their benchmark index. In the "very low" and "low" volatility environments, buy-write strategies and the underlying equity indexes outperformed other strategies over the period of study, perhaps due to the range-bound nature of equities during this period.
Weighing the options
Systematic options-overlay strategies have displayed differentiated risk profiles in a range of macroeconomic and volatility environments over the period of analysis. This may be useful as investors determine how to navigate today's higher equity-market volatility.
Further Reading


Subscribe todayto have insights delivered to your inbox.
1OECD inflation and OECD CLI have been used as a proxy for EAFE countries whereas an equal weighted BRICs inflation and an equal weighted BRICs CLI is used as a proxy for EM countries.2Macro regimes were defined using estimates for inflation as well as the Organization for Economic Cooperation and Development’s composite leading indicator. We calculated and named the four regimes as follows: “stagflation” (falling growth, rising inflation); “heating up” (rising growth, rising inflation); “slow growth” (falling growth, falling inflation); and “goldilocks” (rising growth, falling inflation). We observe the following proportion of months for the respective scenarios: stagflation (EAFE — 26%, EM — 33%); heating up (EAFE — 24%, EM — 9%); slow growth (EAFE — 16%, EM — 17%); and goldilocks (EAFE — 35%, EM — 41%),
The content of this page is for informational purposes only and is intended for institutional professionals with the analytical resources and tools necessary to interpret any performance information. Nothing herein is intended to recommend any product, tool or service. For all references to laws, rules or regulations, please note that the information is provided “as is” and does not constitute legal advice or any binding interpretation. Any approach to comply with regulatory or policy initiatives should be discussed with your own legal counsel and/or the relevant competent authority, as needed.