Factors in Focus: Momentum hits a valuation speed bump
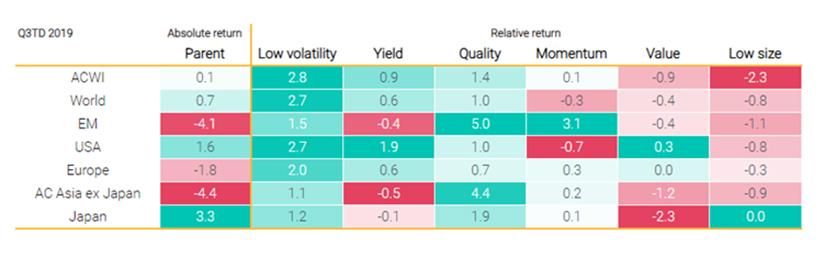
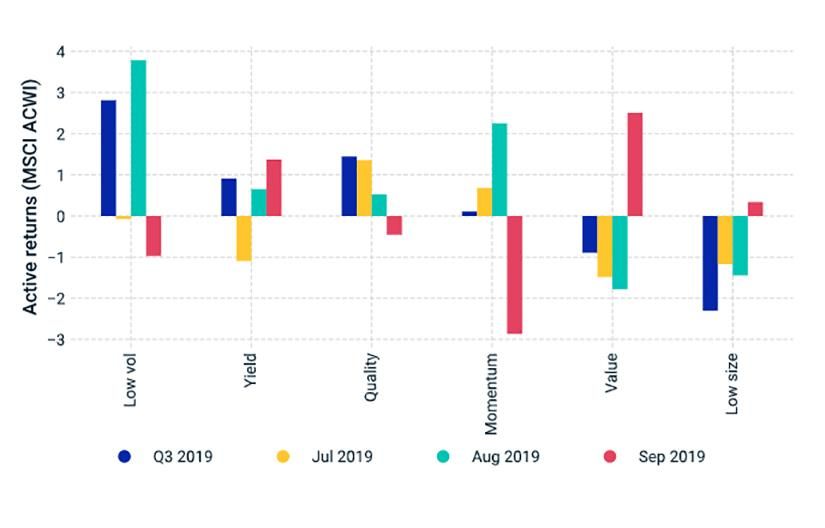
- In the third quarter of 2019, quality and low volatility outperformed across all regions, while the performance of other factors was mixed.
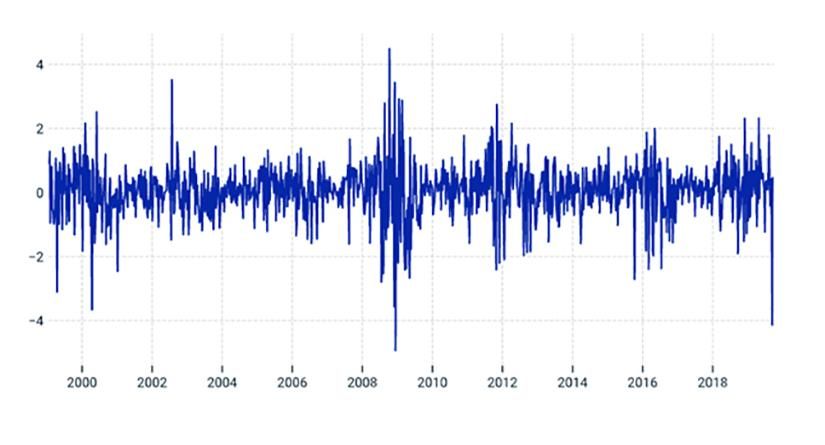
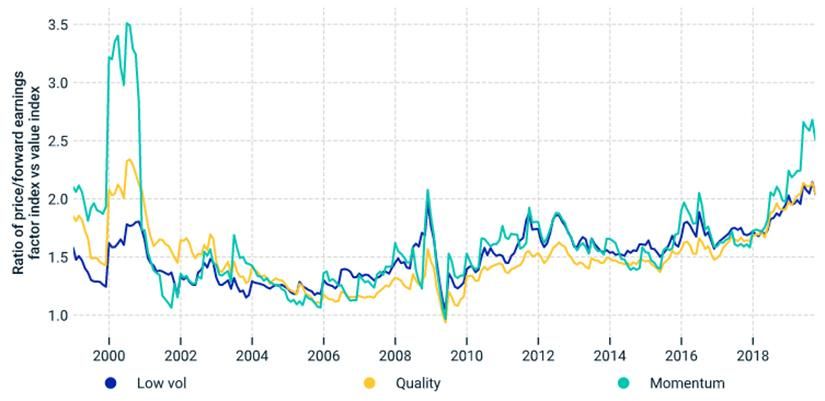
- As the quarter began, momentum was highly overvalued compared to its own past, and thus, the momentum-value spread saw one of the largest corrections in history over the summer.
- Heading into the fourth quarter, our adaptive multi-factor model showed a mild overweight to value and a mild underweight to yield, with all other factors neutral.
September 2019 | Momentum – value | Momentum – value.1 | Momentum/value | Momentum/value.1 |
|---|---|---|---|---|
September 2019 MSCI Indexes | Momentum – value Max September weekly z-score return | Momentum – value.1 No. of previous occurrences that exceeded September 2019 | Momentum/value Current valuation ratio (forward P/E) | Momentum/value.1 Percentile of ratio (forward P/E) |
September 2019 ACWI | Momentum – value -3.69 | Momentum – value.1 1 | Momentum/value 2.62 | Momentum/value.1 0.94 |
September 2019 World | Momentum – value -4.14 | Momentum – value.1 1 | Momentum/value 2.51 | Momentum/value.1 0.94 |
September 2019 Emerging Markets | Momentum – value -1.73 | Momentum – value.1 17 | Momentum/value 2.00 | Momentum/value.1 0.76 |
September 2019 USA | Momentum – value -4.48 | Momentum – value.1 0 | Momentum/value 2.27 | Momentum/value.1 0.94 |
September 2019 Europe | Momentum – value -3.33 | Momentum – value.1 2 | Momentum/value 1.92 | Momentum/value.1 0.89 |
September 2019 AC Asia ex Japan | Momentum – value -1.22 | Momentum – value.1 55 | Momentum/value 2.13 | Momentum/value.1 0.90 |
September 2019 Japan | Momentum – value -2.07 | Momentum – value.1 22 | Momentum/value 2.40 | Momentum/value.1 0.99 |
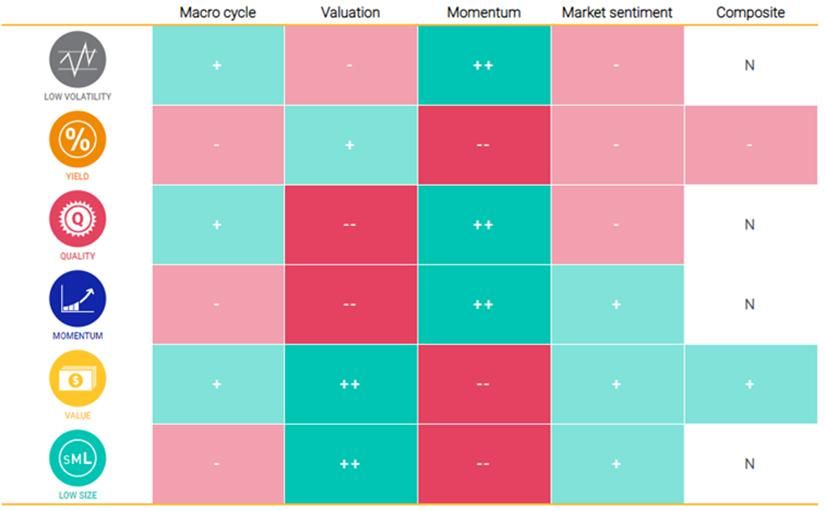
- As of Sept. 28, 2019, our adaptive multi-factor model1 showed the following exposures across the four pillars:
- Macro cycle indicated a mixed signal between slowdown and recovery and overweighted low volatility, quality and value, based on the Chicago National Activity Index, the Federal Reserve Bank of Philadelphia ADS Index and the PMI.
- Valuation overweighted value, low size and yield, based on the valuation gap compared to an equal-weighted factor mix in the context of nearly 30 years of a factor's history.
- Momentum selected momentum, quality and low volatility, based on the last six months' relative performance.
- Market sentiment showed a mild overweight to low size, momentum and value, based on contained credit spreads and an upward-sloping Cboe Volatility Index (VIX) term structure at the time of reference.


Subscribe todayto have insights delivered to your inbox.
The content of this page is for informational purposes only and is intended for institutional professionals with the analytical resources and tools necessary to interpret any performance information. Nothing herein is intended to recommend any product, tool or service. For all references to laws, rules or regulations, please note that the information is provided “as is” and does not constitute legal advice or any binding interpretation. Any approach to comply with regulatory or policy initiatives should be discussed with your own legal counsel and/or the relevant competent authority, as needed.