Back-to-school (momentum) blues?
Blog post
September 13, 2019
- The U.S. price momentum factor, which we highlighted for elevated crowding scores and vulnerability to negative performance at the end of June, suffered a drawdown of 4.7% in the month to date, while the U.S. earnings yield and value factors delivered positive performance.
- U.S. price momentum's underperformance was driven primarily by strong positive performance of negative-momentum stocks and was broad-based by sector. Globally, price momentum also underperformed.
- Current high U.S. price momentum scores from the MSCI Factor Crowding Model imply elevated drawdown risks to U.S. momentum strategies.
Momentum underperformed in the US and globally
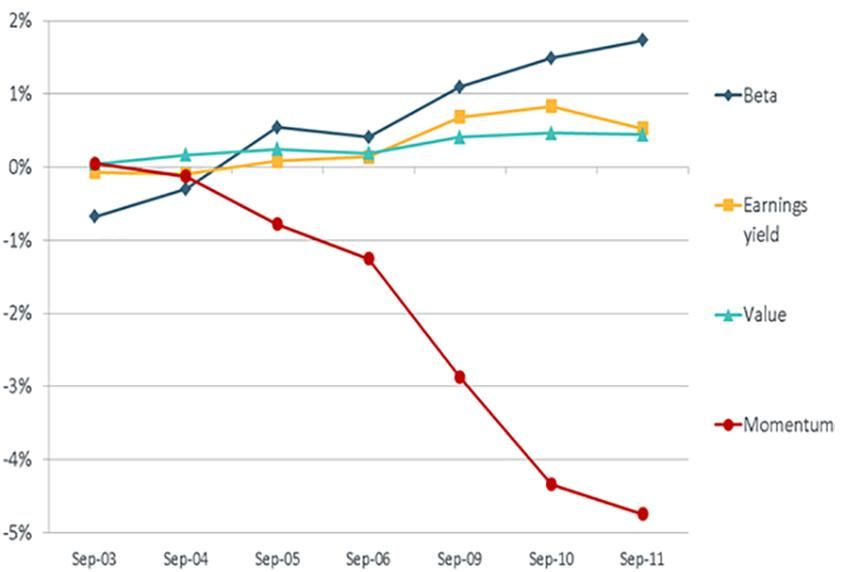
U.S. cumulative factor returns in September
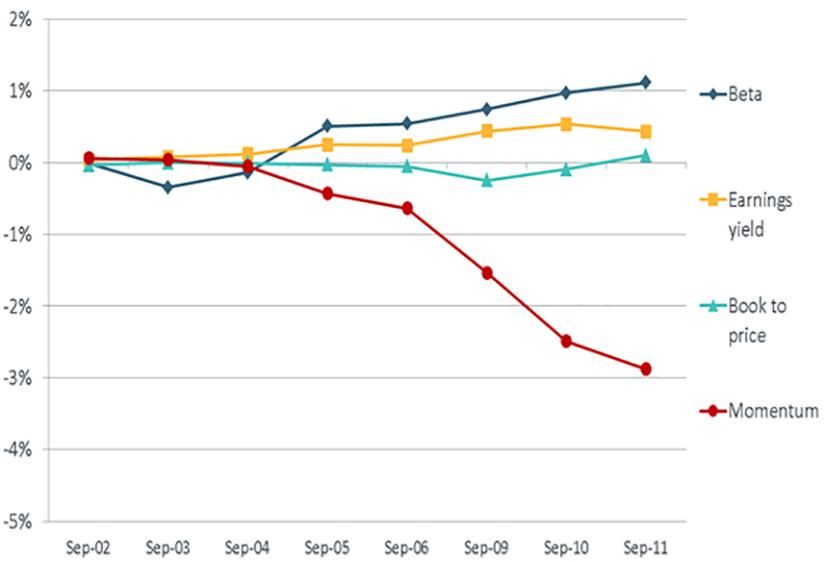
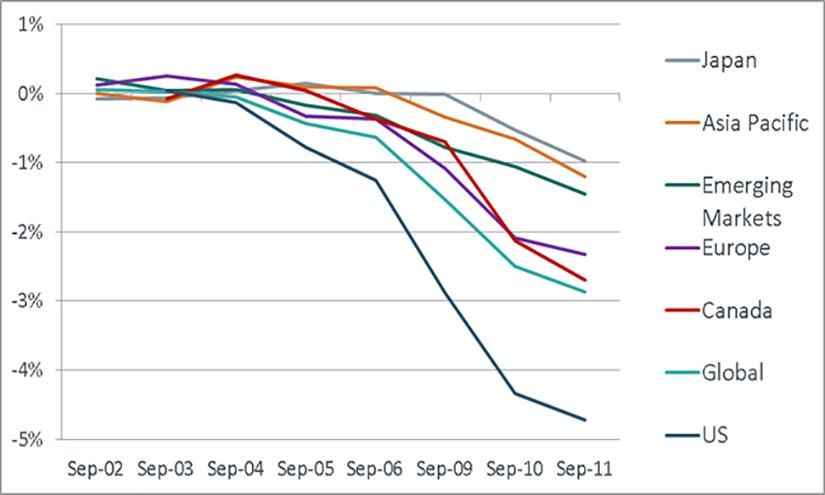
Global cumulative factor returns in September
The momentum drawdown in perspective
Based on its trailing 252-day return volatility, U.S. price momentum's information ratio (IR) was -7.3 in the month to date. In comparison, U.S. price momentum's IR was -8.7 during the four-day Quant Crunch of August 2007 and -4.0 during the early stages of the market turnaround in the second week of April 2009. So far this year, U.S. price momentum has been more of a defensive factor due to the rotation from cyclical to defensive stocks in the second half of last year. It has been negatively correlated with the overall U.S. equity market (-0.16).
Global price momentum, which also exhibited elevated crowding scores at the end of June 2019, had negative performance in September, as well, with an IR of -4.8.
Meanwhile, the performance of other defensive factors, such as size and profitability, was also negative, albeit not to the same extent as momentum. On the other hand, the U.S. earnings yield factor returned 0.5% and had an information ratio of 1.2. Sizable moves among other factors included moves in historical beta, which had strong performance in the U.S. and globally, with IRs of 1.6 and 1.1, respectively; and U.S. value, which was positive, with an IR of 1.3.
U.S. price momentum's underperformance was driven mostly by the positive performance of negative-momentum stocks. Positive-momentum stocks were slightly negative over the same period.
Negative-momentum stocks' outperformance fueled momentum drawdown
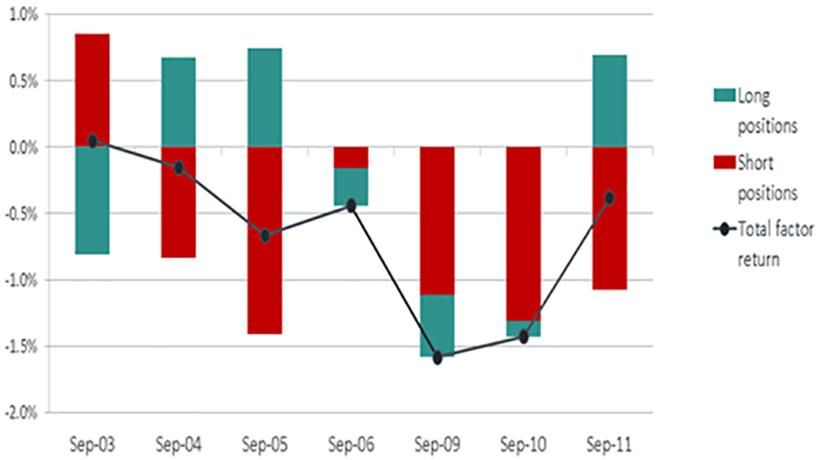
The return of the U.S. price momentum factor represents a return of a dollar-neutral long-short portfolio with a unit exposure to price momentum and zero exposure to all other styles and industries. The portfolio is comprised of roughly 2,400 stocks. The chart shows total-return contributions of long positions and short positions in the portfolio.
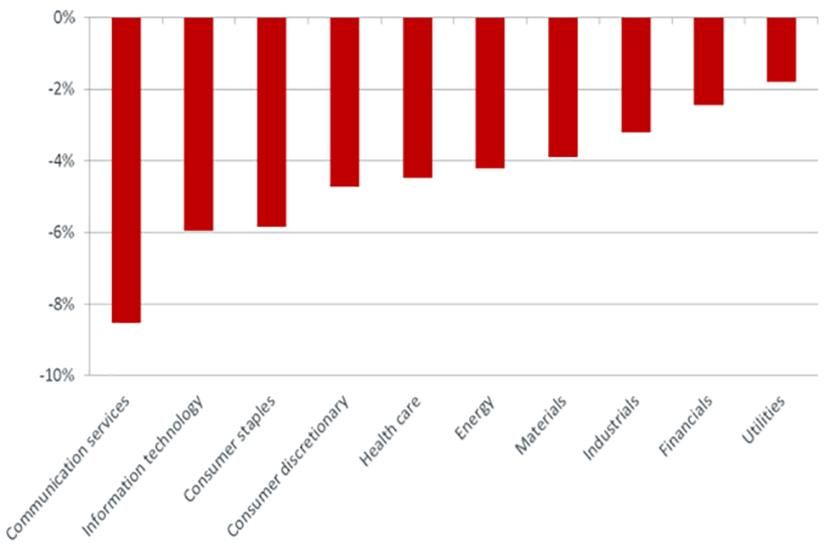
Price momentum had negative performance across sectors and regions
We examined U.S. price momentum's month-to-date performance across sectors using the MSCI U.S. Sector Model. As the exhibit below shows, we found that U.S. price momentum's under-performance was broad; the factor underperformed across all sectors of the Global Industry Classification Standard (GICS®);1 and that communication services, information technology and consumer staples experienced the worst drawdowns. Momentum performance was also negative in Europe, Japan, Asia-ex Japan and emerging markets.
Month-to-date momentum drawdown spanned sectors and the globe
Current crowding scores suggest continued risks to momentum
Despite the recent sell-off, the MSCI Factor Crowding Model shows elevated levels of crowding for U.S. price momentum. While the valuation spread between winners and losers has receded slightly, the pairwise correlation increased due to the increased trading activity in the factor. After years of generally strong momentum performance and weak performance of value strategies, the two have swapped places thus far in September. The most violent moves could be over; but based on the MSCI Factor Crowding model, momentum remains susceptible to elevated drawdown risks, as illustrated in the exhibit below.
US price momentum factor's crowding score remains elevated
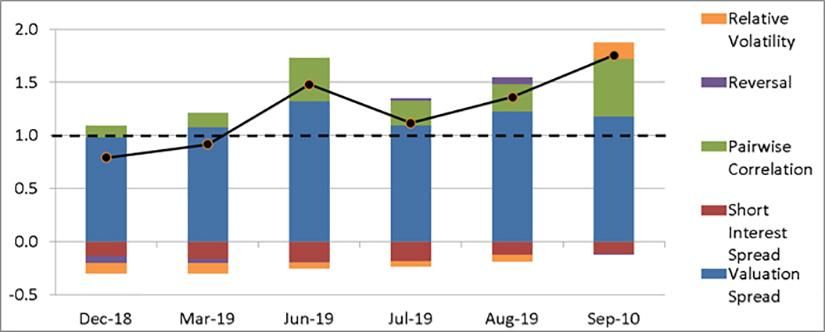
The September 2019 crowding score is as of Sept. 10.
Further Reading

Subscribe todayto have insights delivered to your inbox.
1GICS is the global industry classification standard jointly developed by MSCI and Standard & Poor’s.
The content of this page is for informational purposes only and is intended for institutional professionals with the analytical resources and tools necessary to interpret any performance information. Nothing herein is intended to recommend any product, tool or service. For all references to laws, rules or regulations, please note that the information is provided “as is” and does not constitute legal advice or any binding interpretation. Any approach to comply with regulatory or policy initiatives should be discussed with your own legal counsel and/or the relevant competent authority, as needed.