
Fiscal Dominance Lurks Behind Uncertain Central-Bank Policies
- Government-bond yield curves of developed economies are steepening with central banks’ monetary policies and concerns over government debt and fiscal sustainability.
- Fiscal dominance and institutional risk are key factors in global rates performance in the medium term for fixed-income investors to consider.
- Developments in European and Japanese government-bond markets can be leading signals for the U.S. market.
December was a busy month for global central banks. Global rates performance for 2026 will be driven, in part, by uncertainties about future macroeconomic paths, along with heightened worries over fiscal dominance.1 In the U.S., for example, market volatility may rise if Federal Reserve policy is overtly driven by managing the federal deficit or housing-affordability issues.
Central banks are moving, but not all in the same direction
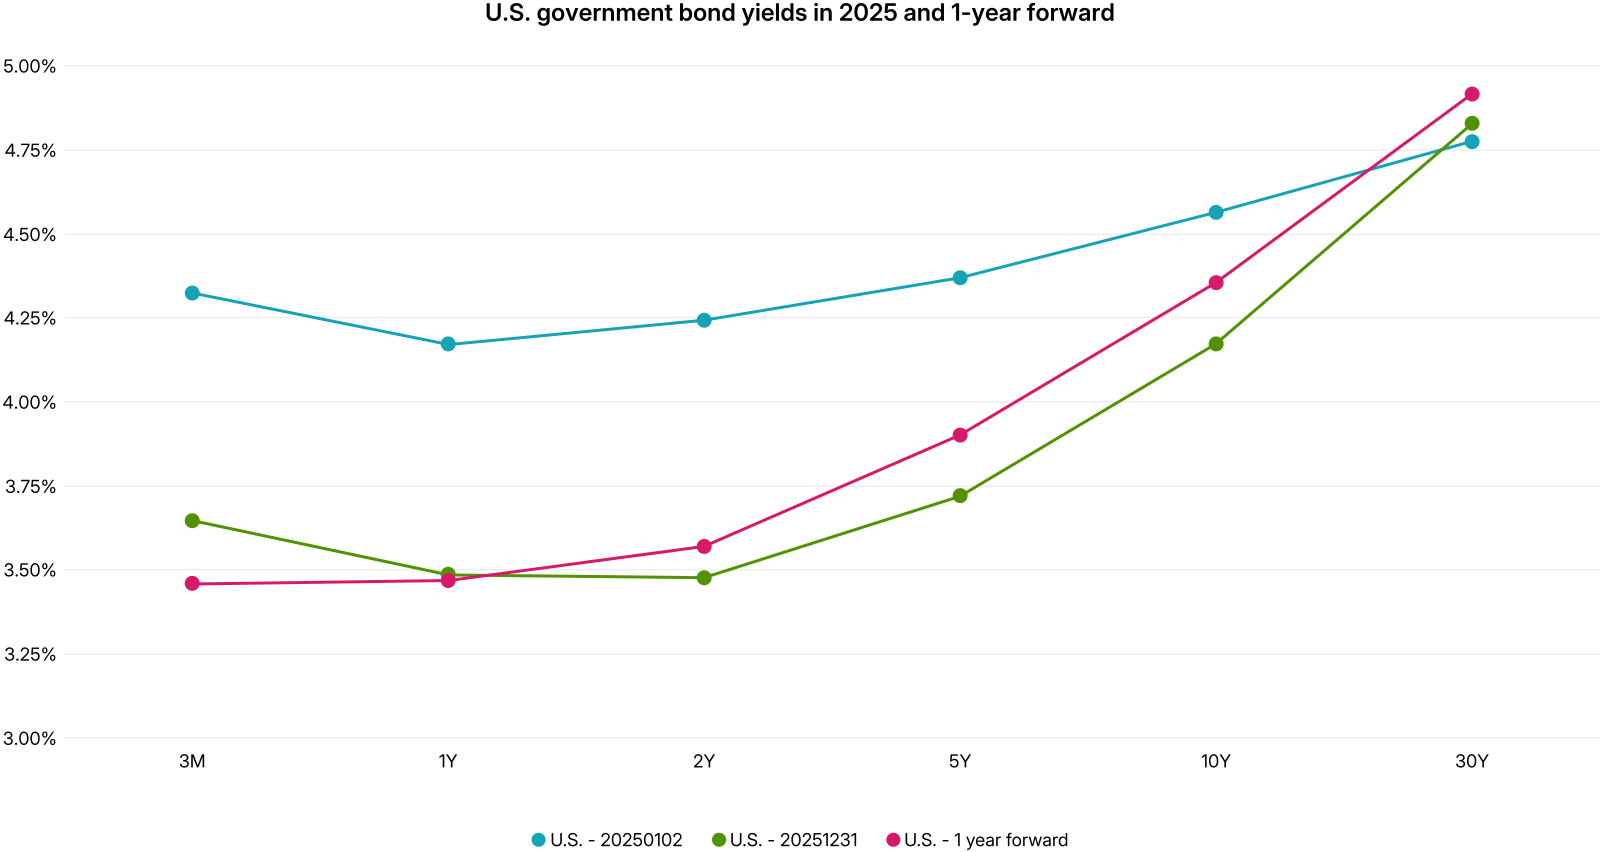
On Dec. 10, the Federal Reserve cut rates by 25 basis points (bps), the third cut since easing began in September. The Fed also resumed modest Treasury purchases to maintain money-market liquidity. Despite the large cuts in the front of the yield curve, the 10-year Treasury yields ended the year about 40 bps lower. The forward curve shows market expectation of a modestly steeper curve for 2026.
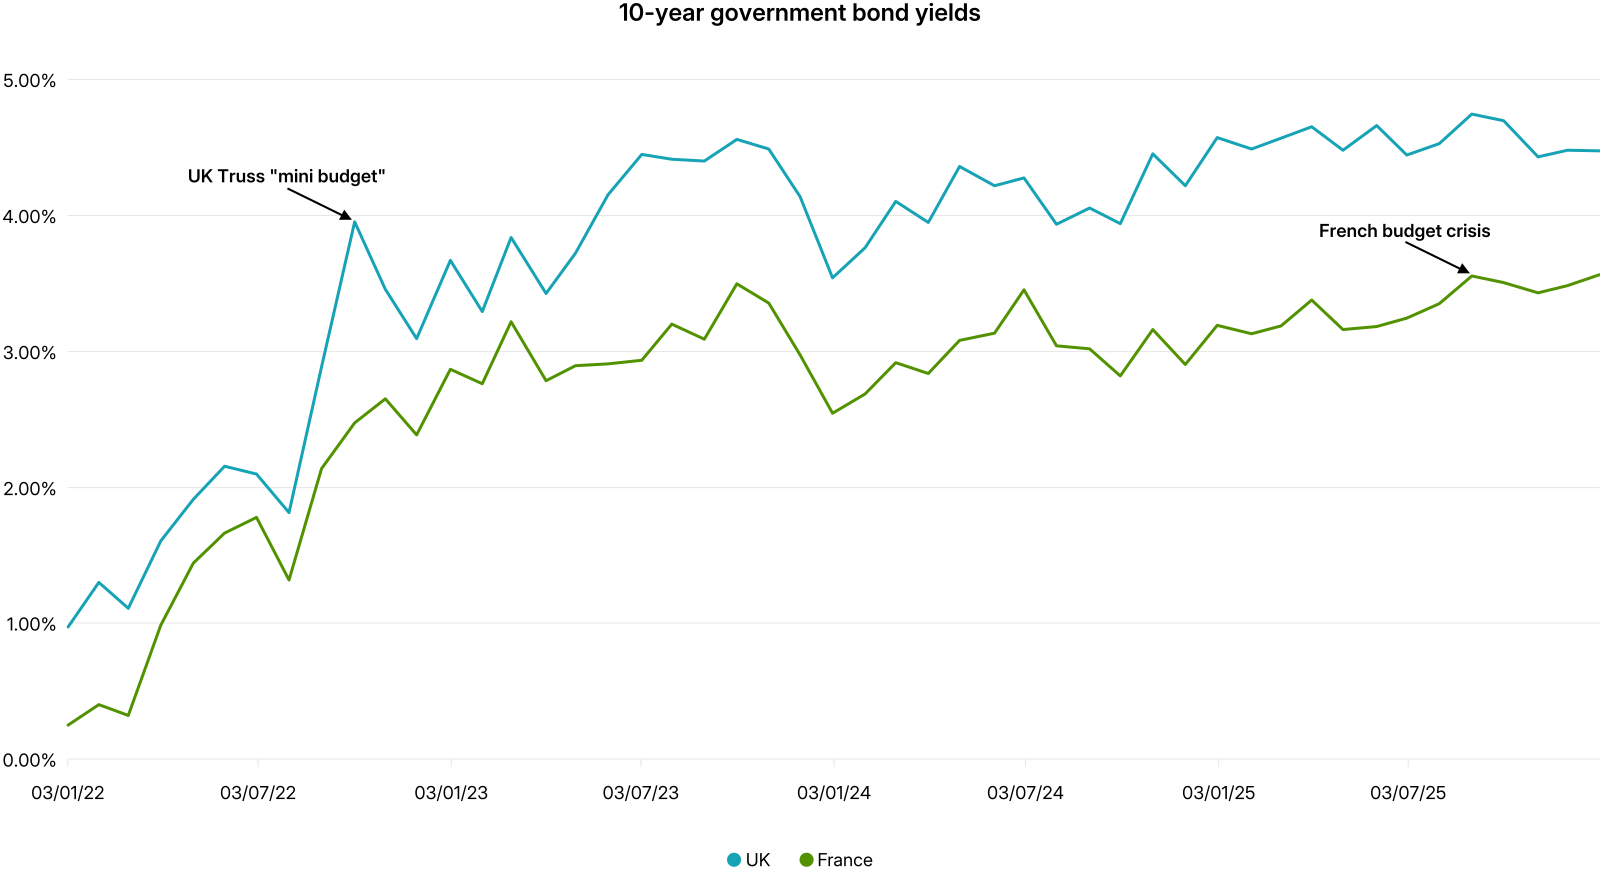
On Dec. 18, the Bank of England narrowly approved its fourth 25-bp rate cut for the year. Further rate cuts are uncertain, with inflation at 3.2%, higher than the 2% target. The European Central Bank, on the same day, citing a better growth and inflation outlook, decided to hold rates, after the ECB’s monetary easing started in mid-2024. For 2025, U.K. 10-year government yields barely changed at around 4.5%, while the French 10-year yields have sold off by about 40 bps to 3.6%.
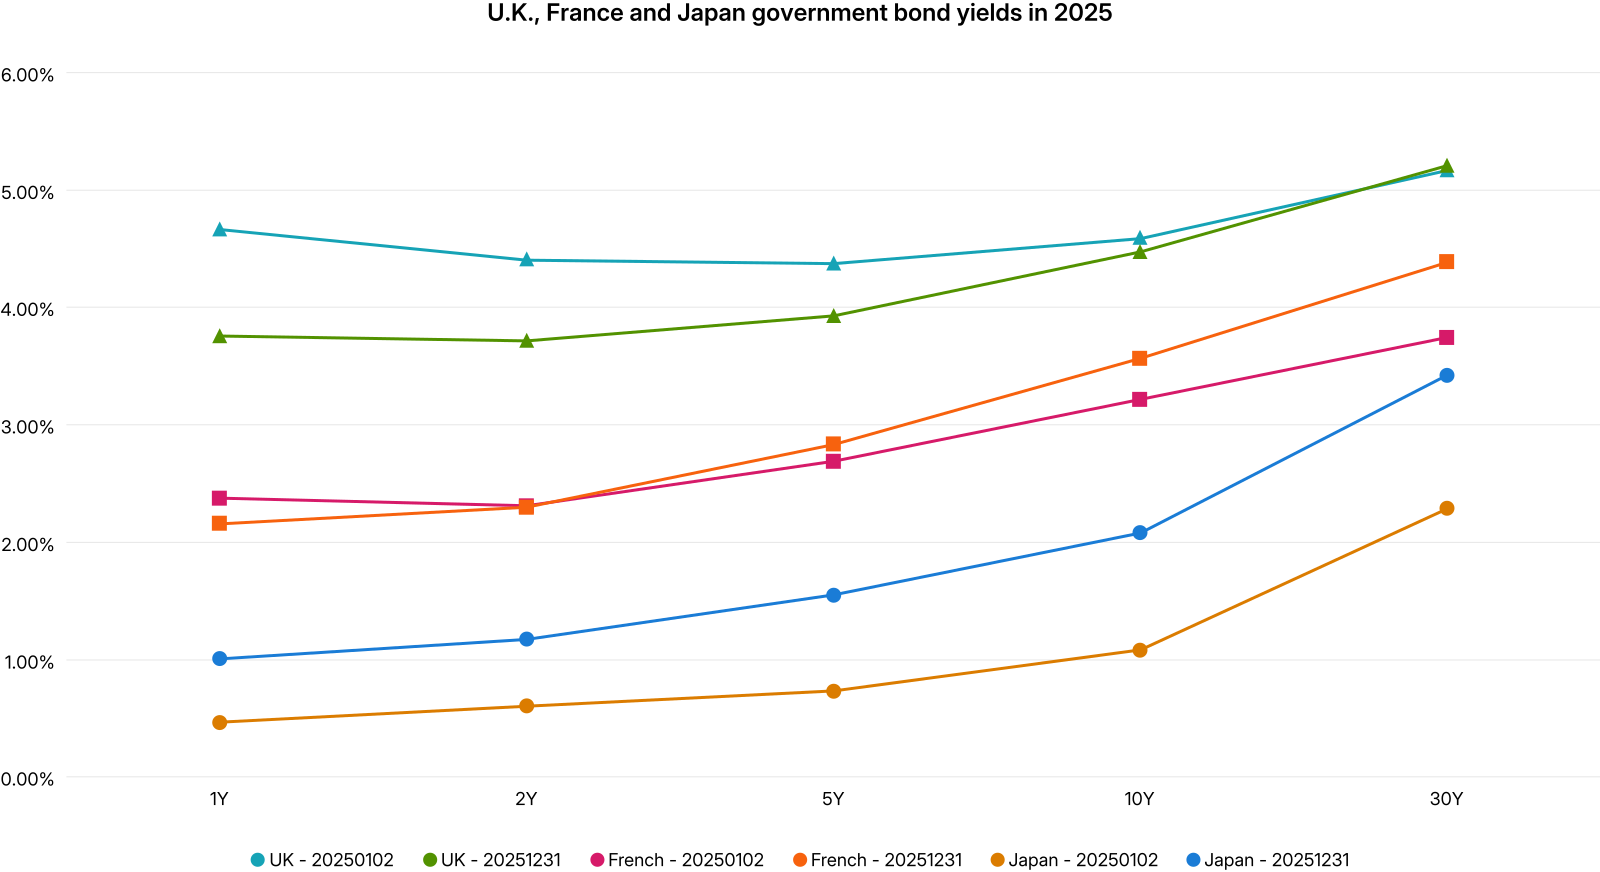
On Dec. 19, the Bank of Japan, continuing its policy normalization that started in 2024, raised its short-term rates by 25 bps, to 0.75%, a three-decade high, while signaling its readiness to tighten further. BOJ started raising its policy rate in January 2025; as a result, 10-year Japanese government-bond yields rose by about 100 bps, to 2%, in 2025.
One of the largest risk factors for yield curves in the U.S. and the developed economies for 2026 and beyond is the potential fiscal-dominance path caused by central banks’ policies, as well as the U.S. housing agencies' potential USD 200 billion mortgage-bond purchase in the short term. While inflation in the U.S., for example, remains above the Fed’s 2% goal, and the unemployment rate has softened to 4.6%, uncertainty over the Fed’s monetary policy is compounded by these potential influences from fiscal authority. But what are the options? The U.S. debt-to-GDP ratio is at 120%, and likely still growing given the current deficit-to-GDP ratio of 6.3%. Many other developed economies are in a similar position, with Japan topping the list with a debt-to-GDP ratio of more than 200%.
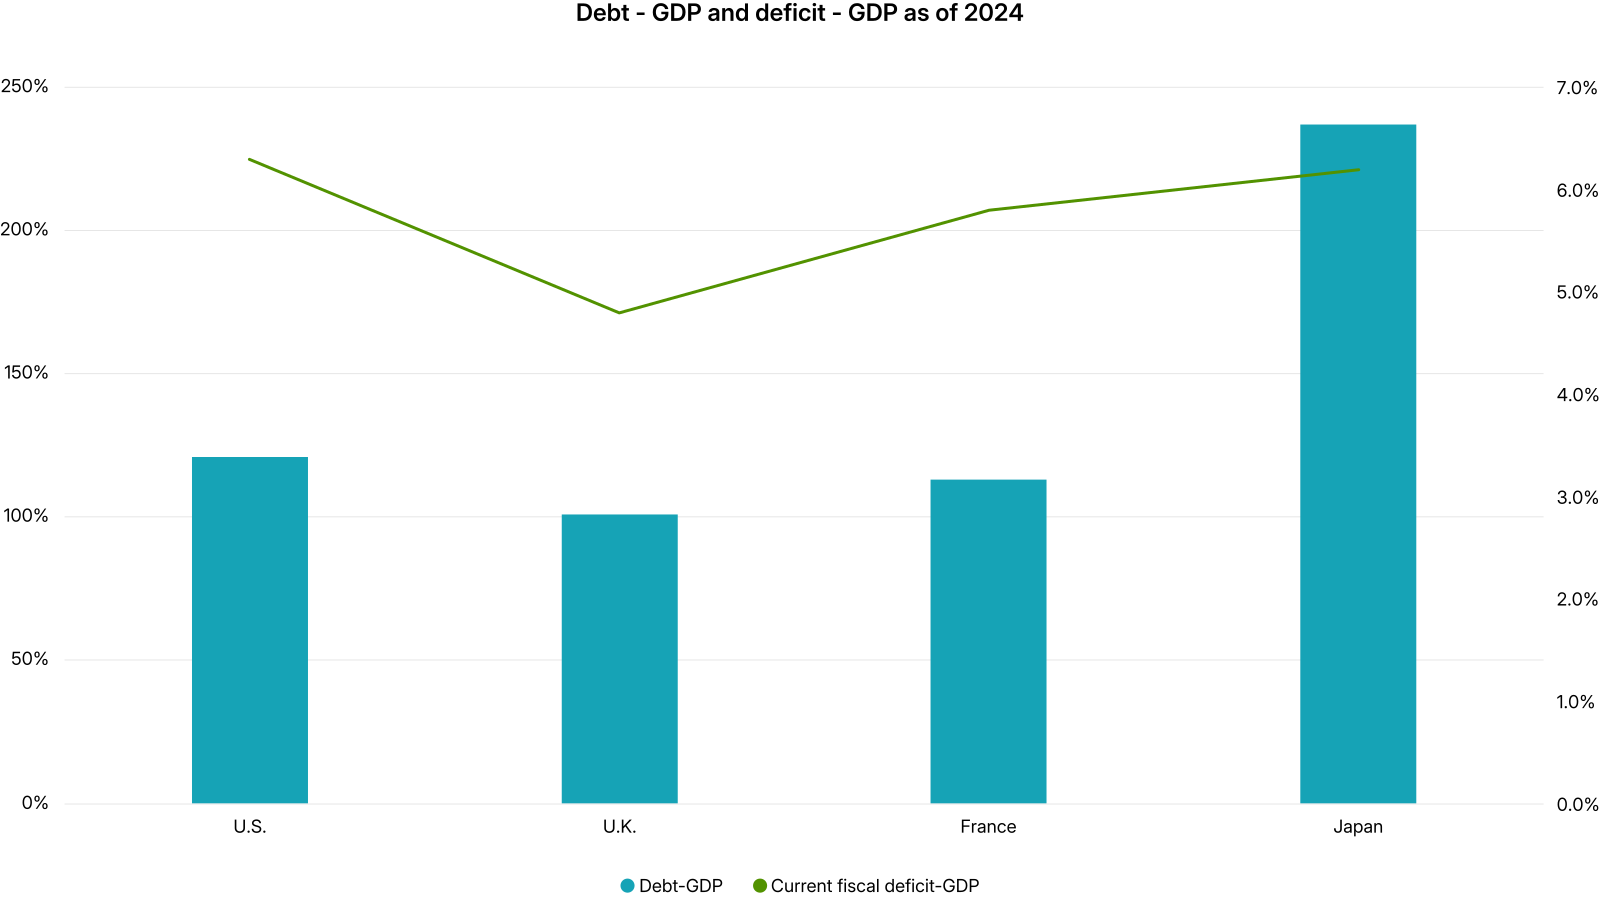
Source: International Monetary Fund
There are numerous actions being proposed to reverse these unsustainable levels. One approach, fiscal compromise — a combination of tax increases and spending cuts — may be difficult given the increased political polarization in the developed world. We saw this play out throughout 2025, including the record-long U.S. government shutdown and frequent government changes in the U.K., France and Japan. That said, the U.S., with a much lower tax rate, may be more amendable.
Failure to achieve sustainable approaches can lead to fiscal dominance. Institutional risk and potential erosion of central-bank independence are key determinants of how fast fiscal dominance becomes the main and default solution. As we can see in the chart below, excessively accommodative U.S. monetary policies have historically led to persistent inflation, a steeper yield curve, higher inflation risk premiums and falling long-term bond prices.
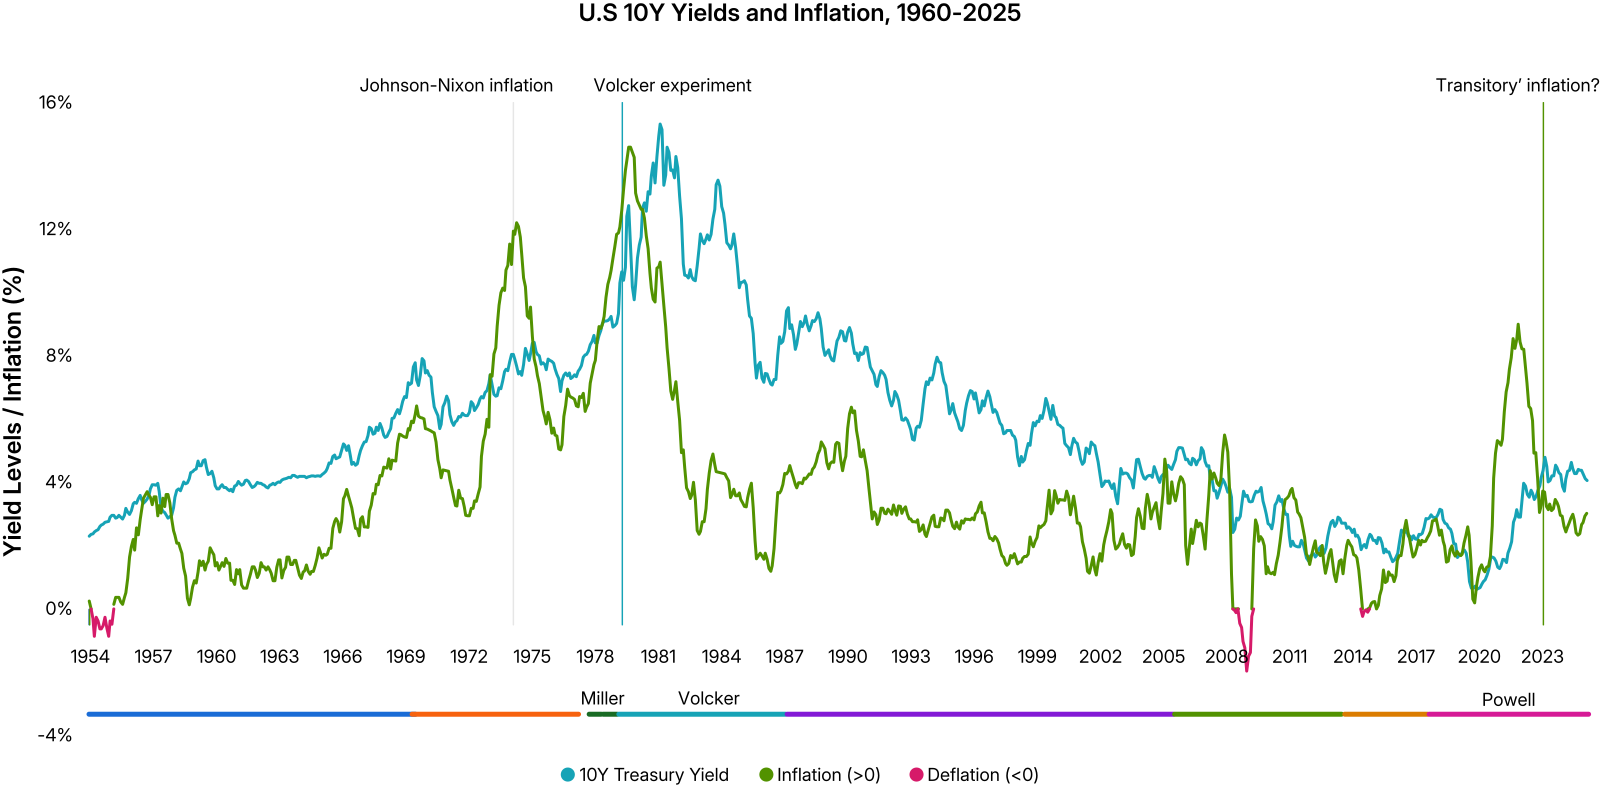
Potential consequences of this easy-money, high-inflation-tolerance policy may be much more severe than previous inflation episodes. U.S. debt-to-GDP ratios were around 30% during the early-1980s stagflation. The currently much higher debt levels leave much less margin for error. We would expect much higher market volatility, as investors may react with more sensitivity to signs of institutional risk in 2026.
‘Gradually and then suddenly’
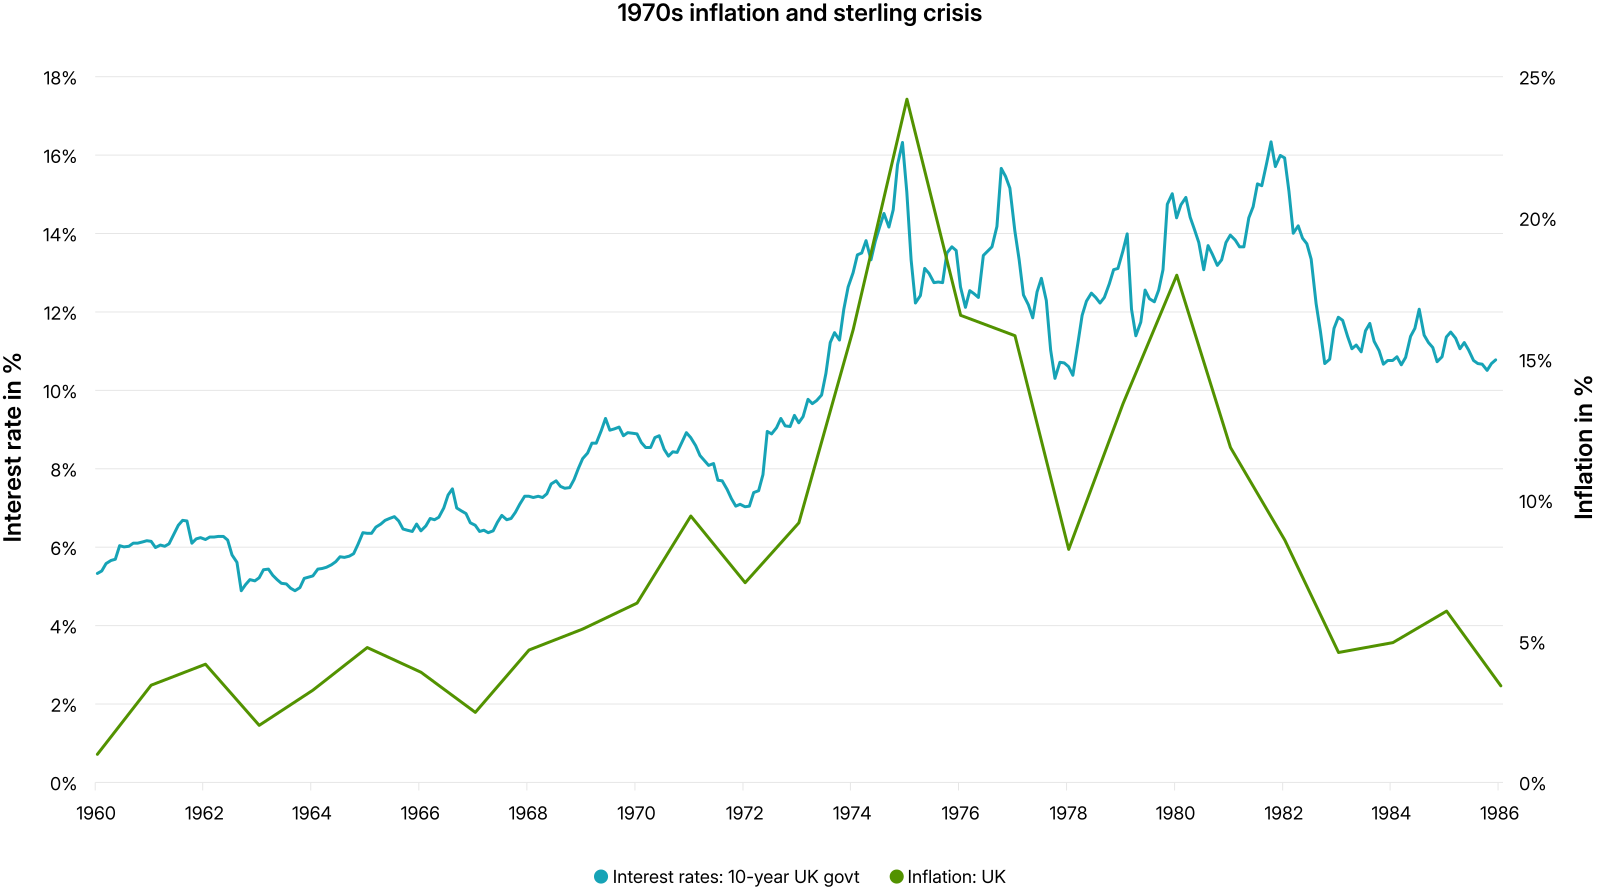
With apologies to Ernest Hemingway, bond investors pondering how — and how quickly — conditions can change may find some guidance in more recent history. Following former U.K. Prime Minister Liz Truss’s mini-budget in September 2022, and during the recent instability around French government leadership, 10-year government-bond yields and spreads in those countries jumped anywhere from 20 to 120 bps. Looking further back, the 1976 U.K. gilt crisis can be linked back to major fiscal expansion that began in 1972, supported by new central-bank policies of easy money and deregulation. While the U.K. has its own currency, and its debt-to-GDP ratio then was less than 50%, inflation rates reached 25% in 1975, and 10-year bond yields increased to over 15%. In the end, the U.K. economy had to be rescued by an IMF loan, which forced drastic budget cuts.
While the market expects only modestly steeper yield curves for the U.S. and other developed economies, institutional risk and fears of resulting fiscal dominance being perceived as the likely solution cannot be dismissed. Investors in U.S. government debt may be able to see history lessons from other developed economies that have higher debt levels and lack the luxury of a global reserve currency.



Subscribe todayto have insights delivered to your inbox.
Investment Trends in Focus: Key Themes for 2026
Markets are moving faster than ever. Explore the research revealing and analyzing the key forces that will shape markets in 2026 — and what these forces could mean for investors.
TINA, Meet TAWD: Euro Sovereigns as a USD Alternative
Fixed-income portfolio managers are eyeing eurozone sovereign bonds as an alternative to Treasurys. But Europe’s sovereign landscape is anything but uniform in quality and diversification benefit.
Fixed Income Offerings
Our holistic approach — integrating indexes, analytics and a robust climate/sustainability framework — sets the stage for portfolio differentiation.
1 Fiscal dominance refers to a situation in which countries’ high debt-to-GDP ratios lead central banks to keep rates low to avoid large interest payments on their debt, risking higher inflation and financial pressure on savers and asset owners.
The content of this page is for informational purposes only and is intended for institutional professionals with the analytical resources and tools necessary to interpret any performance information. Nothing herein is intended to recommend any product, tool or service. For all references to laws, rules or regulations, please note that the information is provided “as is” and does not constitute legal advice or any binding interpretation. Any approach to comply with regulatory or policy initiatives should be discussed with your own legal counsel and/or the relevant competent authority, as needed.