
Investing Across the AI Value Chain
- The accelerating adoption of AI depends on a chain of connected businesses exposed to very different economic risks and opportunities — and therefore, rewards — which makes AI difficult to assess as a single exposure.
- Where exposure sits on the chain matters: Over the full period, the MSCI AI Data Center Infrastructure Index returned 32.4% a year, while AI Model Development was roughly flat.
- The MSCI AI Value Chain Indexes provide asset managers and owners a consistent way to measure AI exposure and gauge the market’s current focus within this space.
Mentioned in this blog post:
The AI value chain is a set of businesses whose products and services are needed to build, run and use AI. In the MSCI AI Value Chain Indexes, we divided it into three layer indexes, defined by the role each plays: Companies in the MSCI ACWI IMI AI Physical Infrastructure Index build and power computing capacity, while firms in AI Digital Infrastructure enable AI model development and use on that capacity and those in AI Applications integrate AI into the products businesses and consumers use.
Within each layer, however, businesses face distinct economics, so we grouped them into 10 segments in all, along economic lines rather than by conventional industry classification.
In AI Physical Infrastructure, hardware makers sell into data-center build-outs, need leading-edge manufacturing and packaging capacity, and are most exposed to customers’ capital-spending plans; energy providers sell power and grid systems under long-term contracts, need generation and grid connections, and are most exposed to the gap between how quickly data centers are built and how long new power takes to come online.
In AI Digital Infrastructure, a cloud platform sells computing capacity on demand, needs hardware and power, and is exposed to utilization and pricing; a model developer sells access to its models, needs compute, data and talent, and is most exposed to competition and the pace of adoption.
In AI Applications, a software company sells AI-enabled products to businesses and consumers, needs models and computing capacity, and is exposed to the pace of adoption and to disruption by AI itself; a maker of autonomous robots sells physical products with embodied AI and is exposed to manufacturing costs, supply-chain squeezes and product cycles.
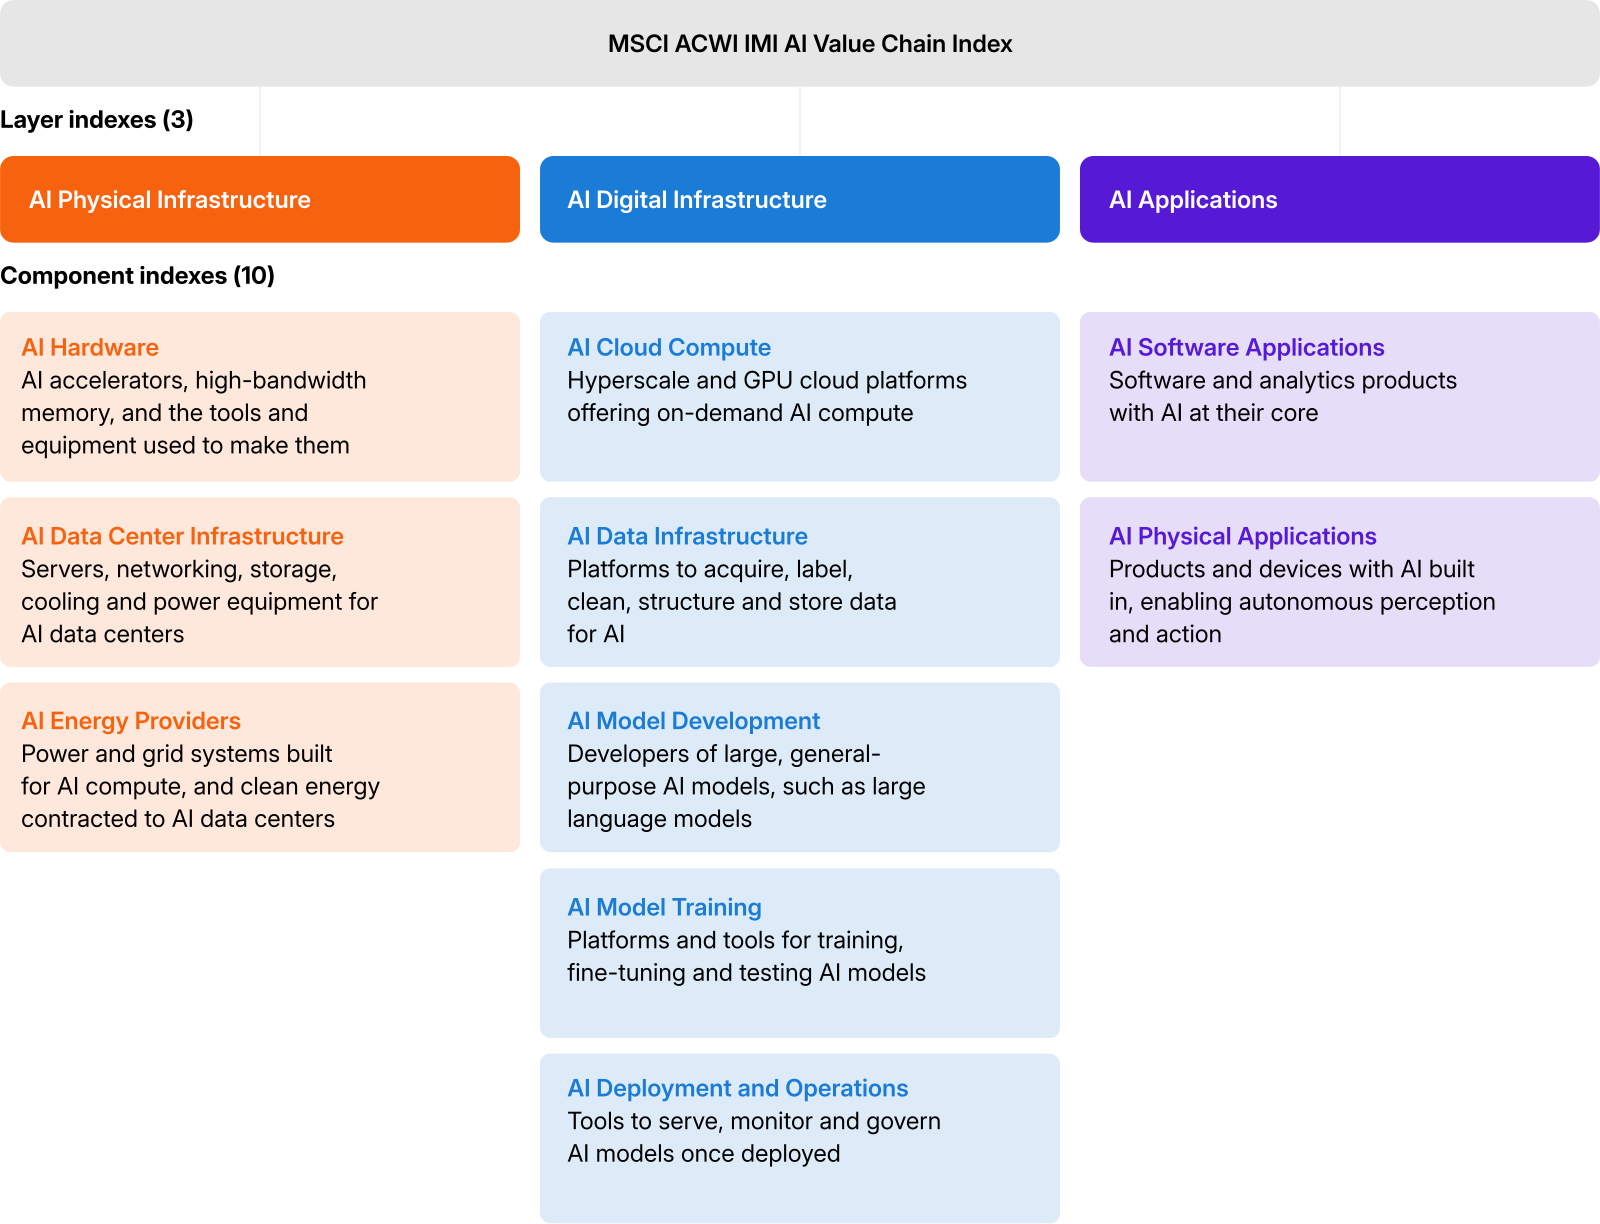
MSCI captures a company’s involvement in the AI value chain through a component-exposure score ranging from 0 to 100 for each segment. The score combines revenue-tagged exposure, i.e., the revenue associated with what the company earns from the segment’s products and services (75%), and the news attention for the segment associated with the company (25%).
MSCI’s 14 indexes follow the structure of the AI value chain described earlier: one for each of the 10 segments (component indexes), one for each of the three layers (layer indexes) and one for the full chain for broad-market AI exposure. Component indexes weight constituents only by component exposure, giving a purer representation of each segment’s performance, while the three layer indexes and the MSCI ACWI IMI AI Value Chain Index are designed for investment at scale, with diversified, high-capacity exposure.
In a simulated backtest,1 the MSCI ACWI IMI AI Value Chain Index, which represents the full chain, returned 16.5% a year and outperformed MSCI ACWI IMITM in five of the six calendar periods, falling behind only in 2022. The layers, however, took turns leading: AI Digital Infrastructure in 2023 and 2024, and AI Physical Infrastructure in 2025 and so far in 2026. AI Applications beat the MSCI ACWI IMI in only three of the six periods and trailed it in both 2025 and 2026. Over the full period, the gaps between component indexes were wider still: AI Data Center Infrastructure returned 32.4% a year, while AI Model Development was roughly flat.
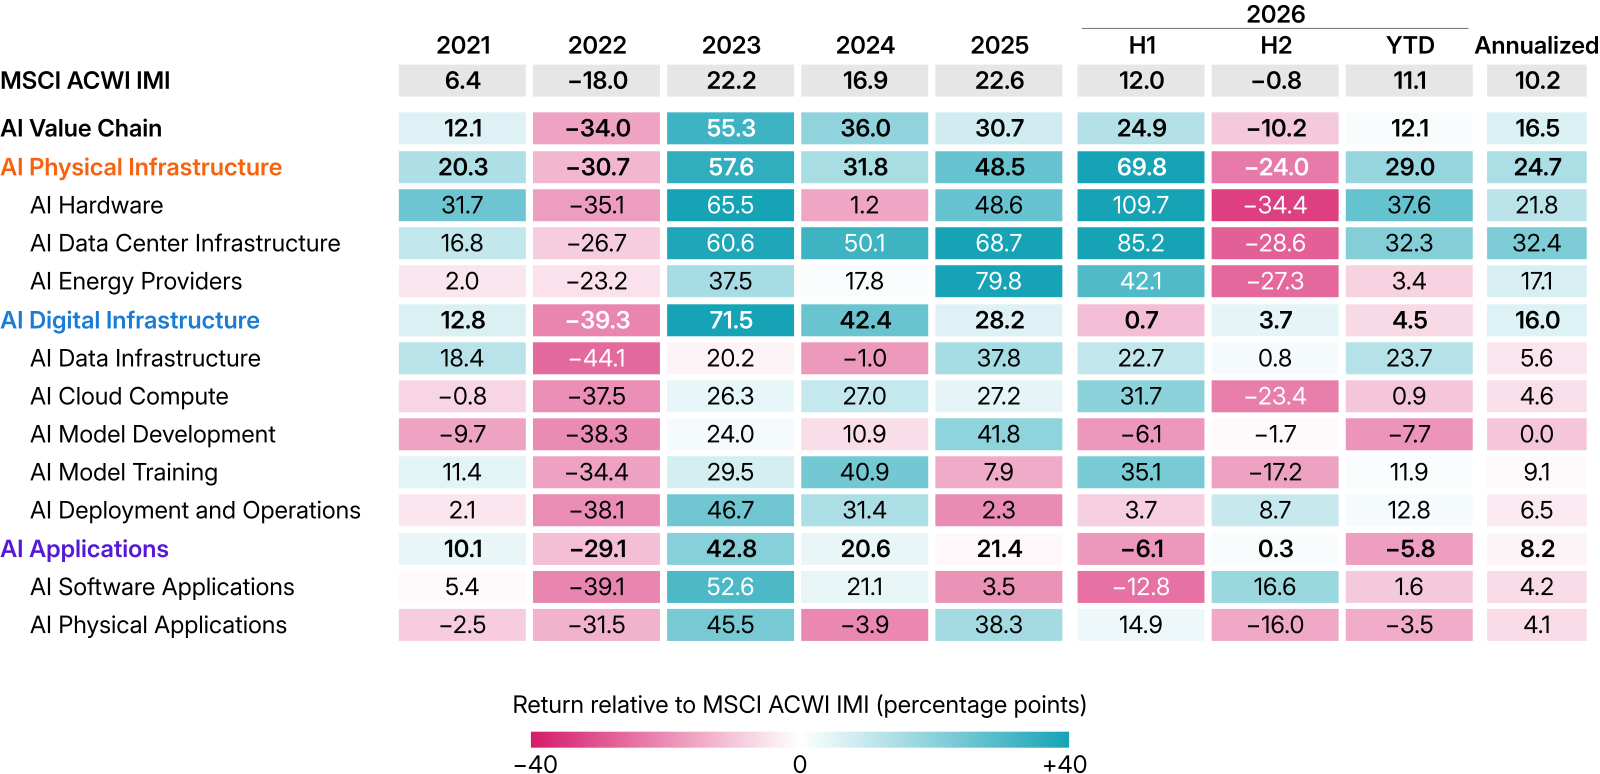
Calendar-year gross total returns in USD (%). 2021 covers May 31 to Dec. 31, 2021. For 2026, H1 covers Jan. 1 to June 30, H2 to date covers July 1 to Nov. 9, 2026, and year to date covers Jan. 1 to Nov. 9, 2026. The annualized column covers May 31, 2021, to Nov. 9, 2026. Shading shows each return relative to MSCI ACWI IMI over the same period. Performance before Sept. 1, 2026, is simulated.
In simulated history, leadership changed hands as the market’s focus moved to different parts of the AI buildout.
Power dominated in 2025: The AI buildout ran up against the grid. With strained grids putting around a fifth of planned data-center projects at risk of delay,2 power became the bottleneck. AI Energy Providers, the companies that supply it, returned 79.8%, the most of any component index.
From late 2025, chips and memory led: The bottleneck then moved from power to chips. Demand for memory outpaced what the few manufacturers could produce, and prices rose sharply.3 From November 2025, AI Hardware began to outperform AI Energy Providers, and it rose 109.7% in the first half of 2026. Over the same six months, AI Software Applications fell 12.8% as fears that AI would disrupt software weighed on the segment.4
Starting midyear 2026, spending doubts arose: The concern moved from supply to demand. Hardware makers depend on their customers’ capital spending, so when investors began to question whether big technology companies could keep raising AI spending,5 AI Hardware turned lower at the end of June. The selling deepened in October and continued into early November, after the U.S. midterm elections. From July onward,6 AI Hardware lost 34.4%, though it was still up 37.6% for the year, while AI Software Applications gained 16.6%.
In a single AI exposure, these moves might partly offset each other. The component indexes track each part of the chain separately, so investors can see which one a shift affects most.
Part of the reason the component indexes moved so differently is that they hold largely different companies. A company may appear in several component indexes, but because each index weights its constituents by component exposure, a company that is central to one segment usually carries little weight in another. AI Cloud Compute and AI Software Applications, for example, share 20 constituents but only 7% of their weight. In nearly three-quarters of the pairs, weight overlap is below 10%, and in just over half, active return correlation is below 0.5. The component indexes therefore hold largely distinct exposures that can be combined to cover the value chain more broadly.
Each cell compares two component indexes, and the buttons switch between three views. Constituent overlap shows how many constituents the two indexes hold in common, shaded by their share of all the constituents the pair holds between them. In this view, the diagonal shows each index’s total number of constituents. Weight overlap shows how much of their weight the two indexes have in common, adding up the smaller of the two weights for each shared constituent. Active return correlation shows how closely the two indexes’ monthly returns relative to MSCI ACWI IMI moved together. Holdings as of Oct. 30, 2026; monthly gross returns in USD from May 31, 2021, to Oct. 30, 2026. Performance before Sept. 1, 2026, is simulated.
The AI value chain consists of businesses that face different economic risks and opportunities, and markets have rewarded them at different times. The MSCI AI Value Chain Indexes follow the taxonomy, with component-exposure scores gauging each company’s linkage to each segment in a consistent way. The MSCI ACWI IMI AI Value Chain Index and the layer indexes are designed to be diversified and high-capacity representations of the broad opportunity set, while the component indexes have been built as purer segment plays. Together, they can support investors seeking to build exposure to the parts of the AI value chain that match their strategic and tactical views, see where their existing AI exposure is concentrated and monitor how the market’s focus is varying across the value chain.



Subscribe todayto have insights delivered to your inbox.
MSCI AI Value Chain Indexes
The MSCI AI Value Chain Indexes span three distinct Layers: physical infrastructure, digital infrastructure and applications. Within each Layer, distinct Components capture specific business activities across the value chain, giving investors a rules-based framework to measure and act on opportunities across the AI landscape.
The AI Sell-off Puts Diversification to the Test
AI stocks fell 14% in the latest sell-off, while low-AI industries rose 6% to 8%. See how much of your portfolio rides on AI, and which parts move independently of it.
1 Period: May 31, 2021, to Nov. 9, 2026. All performance statements refer to gross total returns in USD.
2 International Energy Agency, Energy and AI, April 2025.
3 Ian King, Jin Wu, Stephanie Davidson and Dina Bass, “Why the AI Boom is making everything more expensive,” Bloomberg, March 8, 2026.
4 Danilo Masoni, “Global software stocks hit by Anthropic wake-up call on AI disruption,” Reuters, February 4, 2026.
5 Ryan Vlastelica and Bloomberg, “Wall Street’s favorite bet comes undone as chips whipsaw market,” Fortune, August 2, 2026.
6 Period: July 1, 2026, to Nov. 9, 2026.
The content of this page is for informational purposes only and is intended for institutional professionals with the analytical resources and tools necessary to interpret any performance information. Nothing herein is intended to recommend any product, tool or service. For all references to laws, rules or regulations, please note that the information is provided “as is” and does not constitute legal advice or any binding interpretation. Any approach to comply with regulatory or policy initiatives should be discussed with your own legal counsel and/or the relevant competent authority, as needed.