
The AI Sell-off Puts Diversification to the Test
- Institutional investors with large AI exposure have had no agreed way to measure it. MSCI's AI Value Chain Indexes provide one, and by that measure, global AI stocks lost over USD 6 trillion from Sept. 30 to Nov. 6.
- Our latest equity risk model shows which industries and countries moved independently of AI. Low-AI industry baskets lagged in the post ChatGPT run-up but rose about 5% in the current sell-off as AI stocks fell 14%.
- Industries diversified AI exposure more cleanly than countries, so investors can measure how much of their portfolio rides on AI, find the parts that move independently and decide how much AI concentration to hold.
Mentioned in this blog post:
Global AI stocks lost over USD 6 trillion of market value between late September and Nov. 6, as measured by the MSCI ACWI IMI AI Value Chain Index. The sell-off deepened after the U.S. midterm elections, and sharpened the question we hear most from investors: can they diversify away from AI?
We recently wrote that geopolitics is redefining diversification and that market-cap indexes can concentrate risk in particular issuers, industries and countries. AI is the concentration risk raised most often.
Until recently there was no agreed measure of AI exposure. MSCI's AI Value Chain Indexes provide one, showing what AI has returned and which parts of the market have moved independently of it.
We used these indexes to test whether investors could lower their AI exposure with industry and country indexes, and what it cost them. During the AI run that began in late 2022, industry baskets with low AI correlation lagged by a wide margin. That gap has started to narrow in the sell-off since October. Through election week, the same baskets rose while the AI Value Chain Index fell sharply.
The MSCI AI Value Chain Indexes score each company's exposure to 10 segments of the AI build out, based mainly on AI-related revenue and partly on news attention. Investors can use them to track individual components, or the whole AI complex. The broad index has three layers: Physical Infrastructure (chips, hardware, data centers and energy), Digital Infrastructure (cloud computing and model development) and Applications (software and physical).
The chart below shows the three layers' performance since ChatGPT's launch on Nov. 30, 2022.
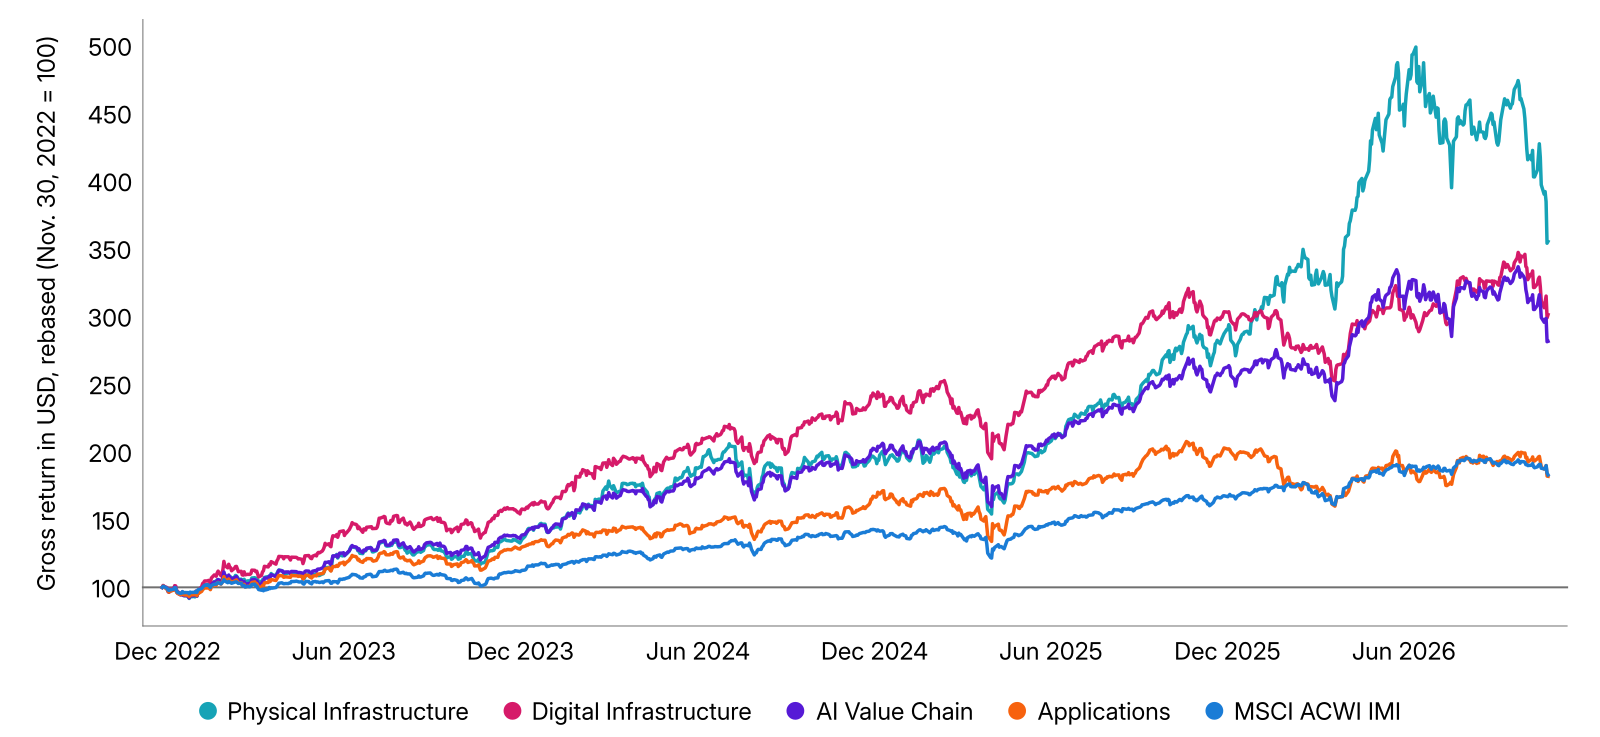
Cumulative gross total returns in USD, rebased to 100 on Nov. 30, 2022, daily through Nov. 6, 2026. MSCI ACWI IMI AI Physical Infrastructure, AI Digital Infrastructure, AI Applications and AI Value Chain Indexes, and MSCI ACWI IMI Index.
Physical Infrastructure has more than tripled since then and its run shows where the early bottlenecks sat. The layer holds the makers of AI accelerators, high-bandwidth memory and chipmaking equipment, alongside the companies that build, cool and power data centers. Digital Infrastructure has tripled, while Applications rose about 80%, in line with the broad market. The AI Value Chain Index outpaced the MSCI ACWI IMITM Index by about 14% a year since late 2022.
The physical layer's concentration cut the other way in the sell-off: From Sept. 30 to Nov. 6 it fell 22%, the steepest drop of the three layers, leaving it 30% below its June peak. Digital Infrastructure and Applications were more resilient, falling 10% and 6%, respectively.
The indexes also map where AI exposure sits. At the end of October, the U.S. made up almost 80% of the AI Value Chain Index, against 64% of the MSCI ACWI IMI Index (chart, left). Physical Infrastructure held large weights in Taiwan and Korea, home to leading chip foundry and memory makers.
Industry exposure is more concentrated still. Four Global Industry Classification Standard (GICS®)1 industry groups (semiconductors, software & services, media & entertainment and technology hardware) make up over 70% of the AI Value Chain Index, double their 35% weight in the broad market (chart, right). That concentration makes industries and countries natural places to look for diversification.
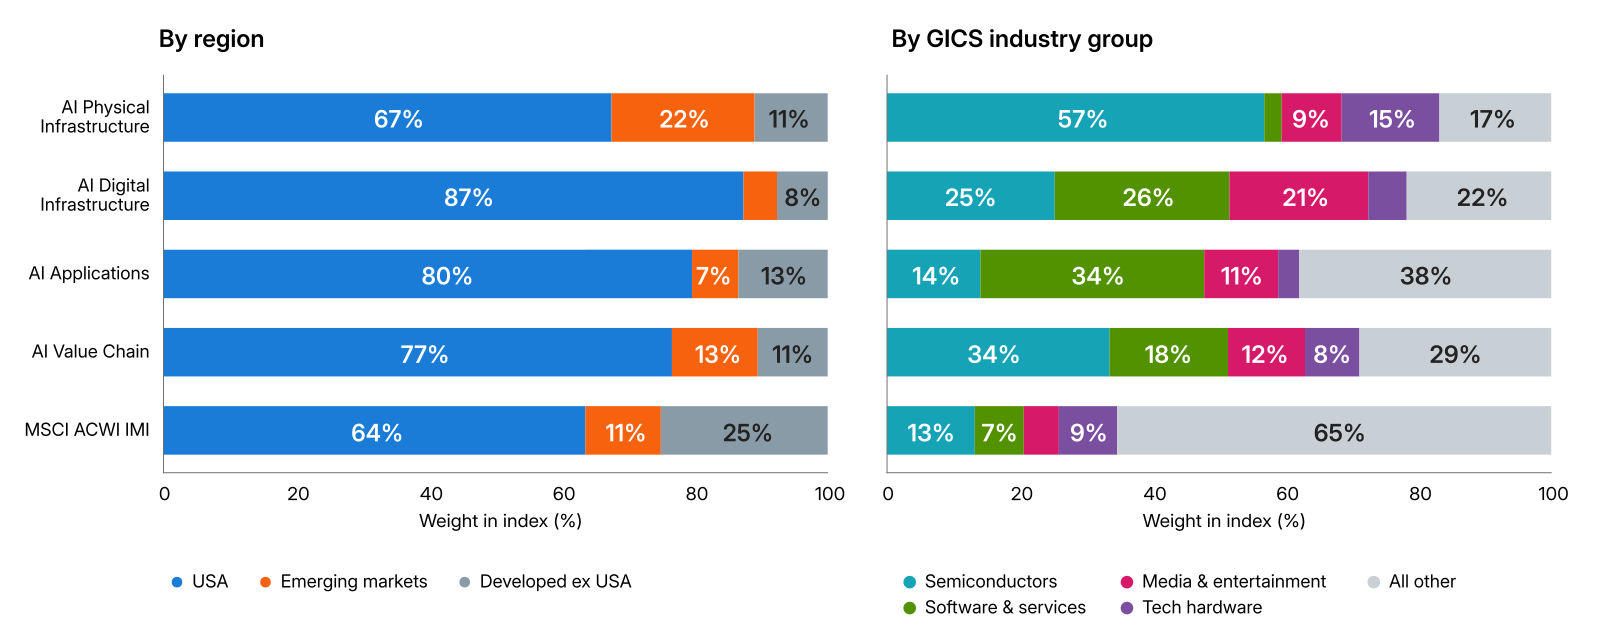
Index weights at the close of Oct. 30, 2026. Left: by region, which follows MSCI market classification. Right: by GICS industry group.
We sorted the 25 global industry groups each month into three baskets by their ex-ante correlation with the AI Value Chain Index, as forecast by MSCI's global equity risk model: high, mid and low correlation.2
The sort held out of sample. The risk model's forecast correlations were highly predictive of realized correlations in the following month. Measured ex-post, the high-correlation basket has carried a correlation to the AI Value Chain Index about 0.55 higher than the low-correlation basket on average. Market-wide swings moved all three baskets together, but the ordering held throughout.
Some industries never change groups. Semiconductors, capital goods and technology hardware have always been in the high-correlation basket, while food, beverage & tobacco and household & personal products have always been in the low-correlation basket.
Software & services migrated, and in October it sat in the mid-correlation basket. Software has swung with the market's view of AI as customer or threat. Early in 2026, fears that AI would disrupt software businesses (the so-called SaaSpocalypse) pulled the industry away from the AI complex.
MSCI's equity risk model shows what drives these differences (below). About half of the gap in AI correlation between the high- and low-correlation industry baskets comes from their business mix alone; most of the rest comes from their style exposures such as beta. Country baskets differ too, but mainly through style, and the model forecasts them less reliably.
Industries group companies by activity, the same basis that defines AI exposure, while AI crosses borders through the supply chain. A country registers as AI linked mainly where a few supply-chain leaders dominate, as in Taiwan and Korea. For now, that makes industry mix a more direct lever for reducing AI exposure than adjusting country or style tilts.
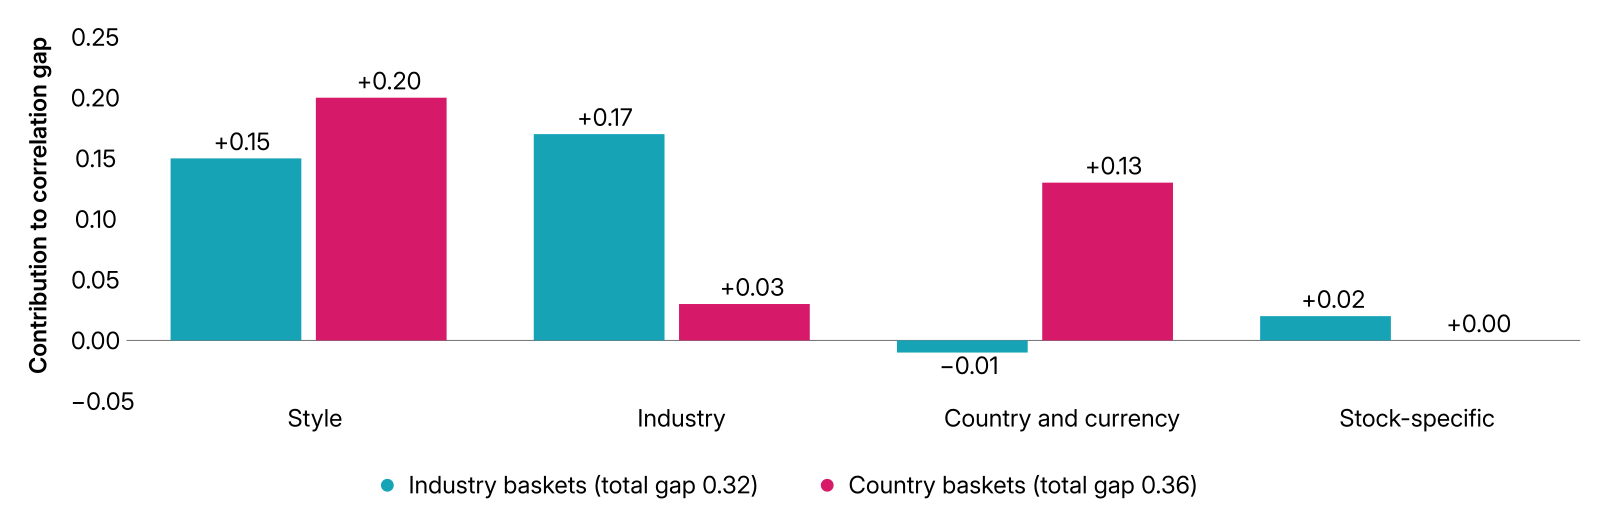
Average difference in ex-ante correlation with the MSCI ACWI IMI AI Value Chain Index between the high- and low-correlation baskets, split by factor group in the MSCI EFMGEMLT model, at month-ends from June 2021 to October 2026; total-correlation sort.
Over this period, however, holding the mid- and low-correlation baskets meant missing much of the AI rally (below). Since ChatGPT's release, both baskets trailed the MSCI ACWI IMI Index and the AI Value Chain Index by wide margins, while the high-correlation basket kept pace. The result holds whether industries are sorted on total or active correlation.
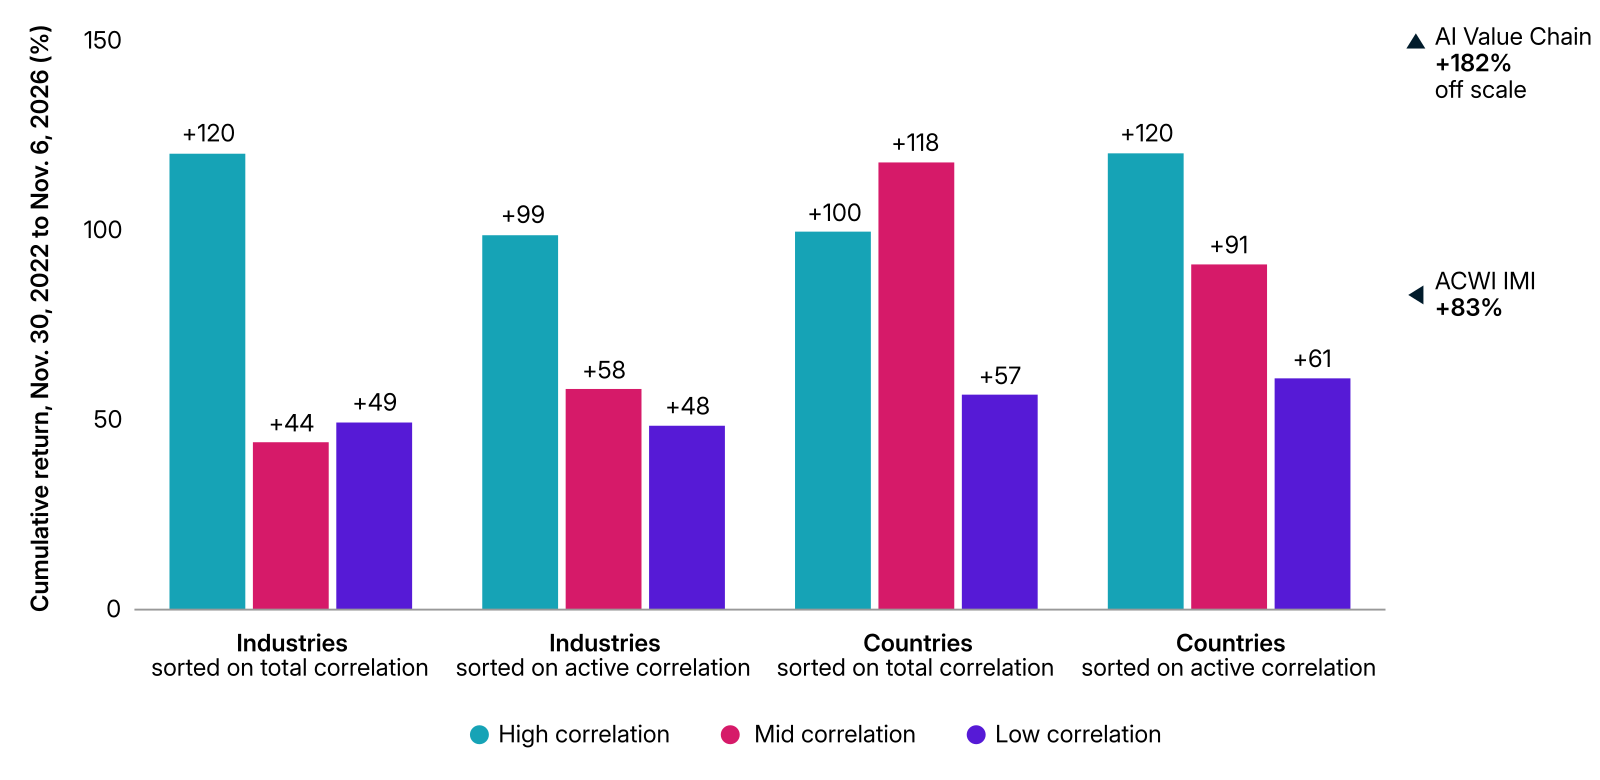
Cumulative gross total returns in USD, Nov. 30, 2022 to Nov. 6, 2026. Equal-weighted baskets of the 25 MSCI ACWI Industry Group Indexes and 47 MSCI country indexes, sorted each month into terciles by ex-ante correlation to the MSCI ACWI IMI AI Value Chain Index from the MSCI EFMGEMLT model, measured on total returns or on returns relative to MSCI ACWI IMI. Baskets are analytical constructions, not MSCI indexes.
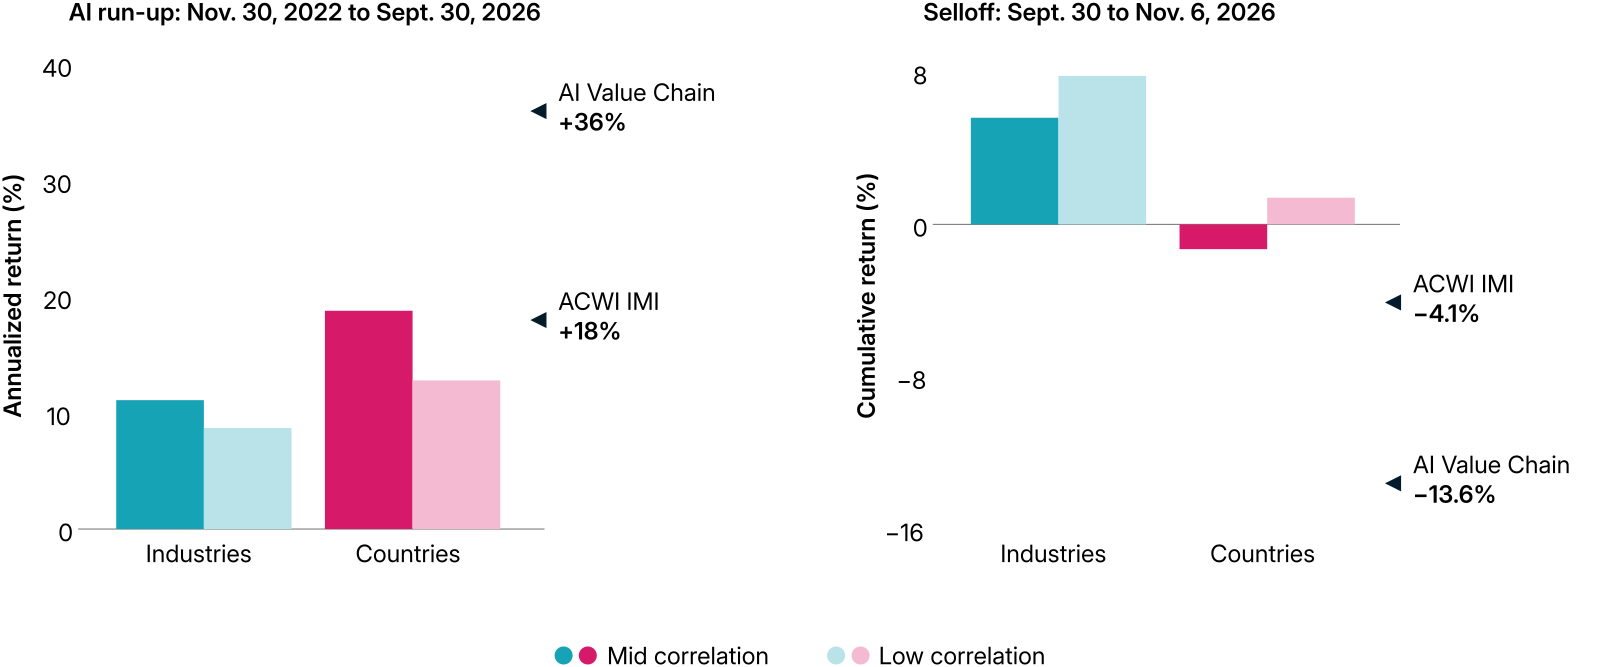
Cumulative gross total returns in USD, active-correlation sort. Baskets are analytical constructions, not MSCI indexes.
The sell-off offered a live test, shown above. Lower-correlation industries rose 6% to 8% as AI fell 14%, while their country counterparts barely moved. Five weeks is too short to establish dependable protection, but industry diversification held up in this episode.
Markets appear to be weighing the risk of a turn in the AI run-up. The sell-off accelerated in election week, when voters backed restrictions in most of the data center measures on the ballot. The AI Value Chain Indexes measure that reaction for global investors, and they show how closely other parts of the market move with AI.
Investors could split their equity allocations into AI Value Chain stocks and the rest. In a simulation, removing AI Value Chain stocks from the MSCI ACWI IMI Index would have cushioned the latest leg of the sell-off, but, again, only by taking large industry bets.
Whatever the approach, a practical sequence applies: measure AI concentration, identify the common risk drivers behind it and assess potential diversifiers alongside the other exposures they bring.

Subscribe todayto have insights delivered to your inbox.
Markets in Focus: AI's Partners Become its Prey
U.S. software is being repriced as AI's next casualty — but with earnings forecasts still rising, the market may be moving far ahead of the disruption it fears.
Geopolitics Is Redefining Diversification
Global investing has long rested on the idea that capital finds its most productive use. As geopolitics disrupts that, market-cap indexes can inadvertently concentrate risk in particular markets.
1 GICS is the industry-classification standard jointly developed by MSCI and S&P Dow Jones Indices.
2 Each month-end, we computed the ex-ante correlation between each MSCI ACWI Industry Group Index and the MSCI ACWI IMI AI Value Chain Index using the MSCI EFMGEMLT. The total sort uses the correlation of total returns; the active sort uses the correlation of returns relative to MSCI ACWI IMI. We split the 25 industry groups into terciles (eight, nine and eight groups) and held each tercile as an equal-weighted basket for the following month. Returns are gross total returns in USD, chained monthly from Nov. 30, 2022; the first baskets were formed on June 30, 2021.
The content of this page is for informational purposes only and is intended for institutional professionals with the analytical resources and tools necessary to interpret any performance information. Nothing herein is intended to recommend any product, tool or service. For all references to laws, rules or regulations, please note that the information is provided “as is” and does not constitute legal advice or any binding interpretation. Any approach to comply with regulatory or policy initiatives should be discussed with your own legal counsel and/or the relevant competent authority, as needed.