Is Greenium Evaporating in USD Corporate Bonds?
Key findings
- As the market for sustainable (labeled) bonds has grown rapidly in recent years, it is useful to define an analytically solid and consistent approach to estimating their value relative to conventional bonds.
- In our analysis of USD-denominated corporate labeled bonds issued in recent years, we found they consistently traded at a 1- to 6-basis-point tighter spread than what would have been implied by their issuers’ yield curves.
- Labeled bonds issued by companies in the utilities sector exhibited the largest greenium compared to other sectors. We did not find a significant impact from other bond characteristics, such as time since issuance or to maturity, on the observed results.
Green, social, sustainability and sustainability-linked (or "labeled") bonds — instruments aimed at advancing sustainability-related goals in fixed-income markets — have undergone rapid growth in issuance and presence in global bond benchmarks. There is some evidence that labeled bonds have exhibited a green premium, or "greenium" — a higher valuation compared to conventional bonds.[1] Monitoring this greenium's evolution over time and in different market environments may prove useful to investors in relative-value considerations and in monitoring spread risk over time.
We explored this topic in 2020, when the market was picking up significant growth momentum, and had found that green bonds traded at a consistently lower yield (i.e., a higher price or a premium) during our study period. Three eventful years later, we revisit and build on this analysis, by expanding the sampled-bond universe and digging deeper to uncover potential differences among corporate sectors.
Estimating the greenium
We examined the difference between the option-adjusted spread (OAS) of a labeled bond and the corresponding point on its issuer's curve. The difference, if any, between the labeled bond's actual spread and that implied by the issuer's curve was the premium (or discount) at which the market priced labeled bonds.
We applied several filters to ensure the comparability of the studied bonds and their issuers' yield curves. Specifically, we included only nondistressed (price over 70% of face value or OAS under 1,000 basis points), fixed-coupon, USD-denominated, senior corporate bonds with at least one year to maturity.[2] Finally, as the issuers' yield-curve construction might include their own labeled bonds, we included only those issuers whose yield curves were primarily derived from conventional (nonlabeled) bonds. While these measures severely restricted our study sample, they should have also led to a considerably more reliable estimate of greenium.
Using the issuer's yield curve and spread to estimate greenium
Loading chart...
Please wait.
Example of a California-based utility company's yield curve and spreads implied by the yield curve. Hover the cursor over the curve and dots to see more data. Data as of June 30, 2023.
Labeled bonds in our sample had traded at a 1- to 6-basis-point tighter OAS versus their issuers' curves between January 2021 and December 2023 (the greenium). While the sampled labeled bonds traded at this premium the entire study period, it decreased as time went on, particularly over 2022 and 2023. This abatement could have been caused by several factors: the increased supply of labeled bonds in recent years (which also improved our data availability), muted demand linked to higher interest rates that offer attractive riskless alternatives or the increased bond-market volatility that could have erased some of the pricing differences.[3]
Sampled labeled bonds traded at a consistent premium
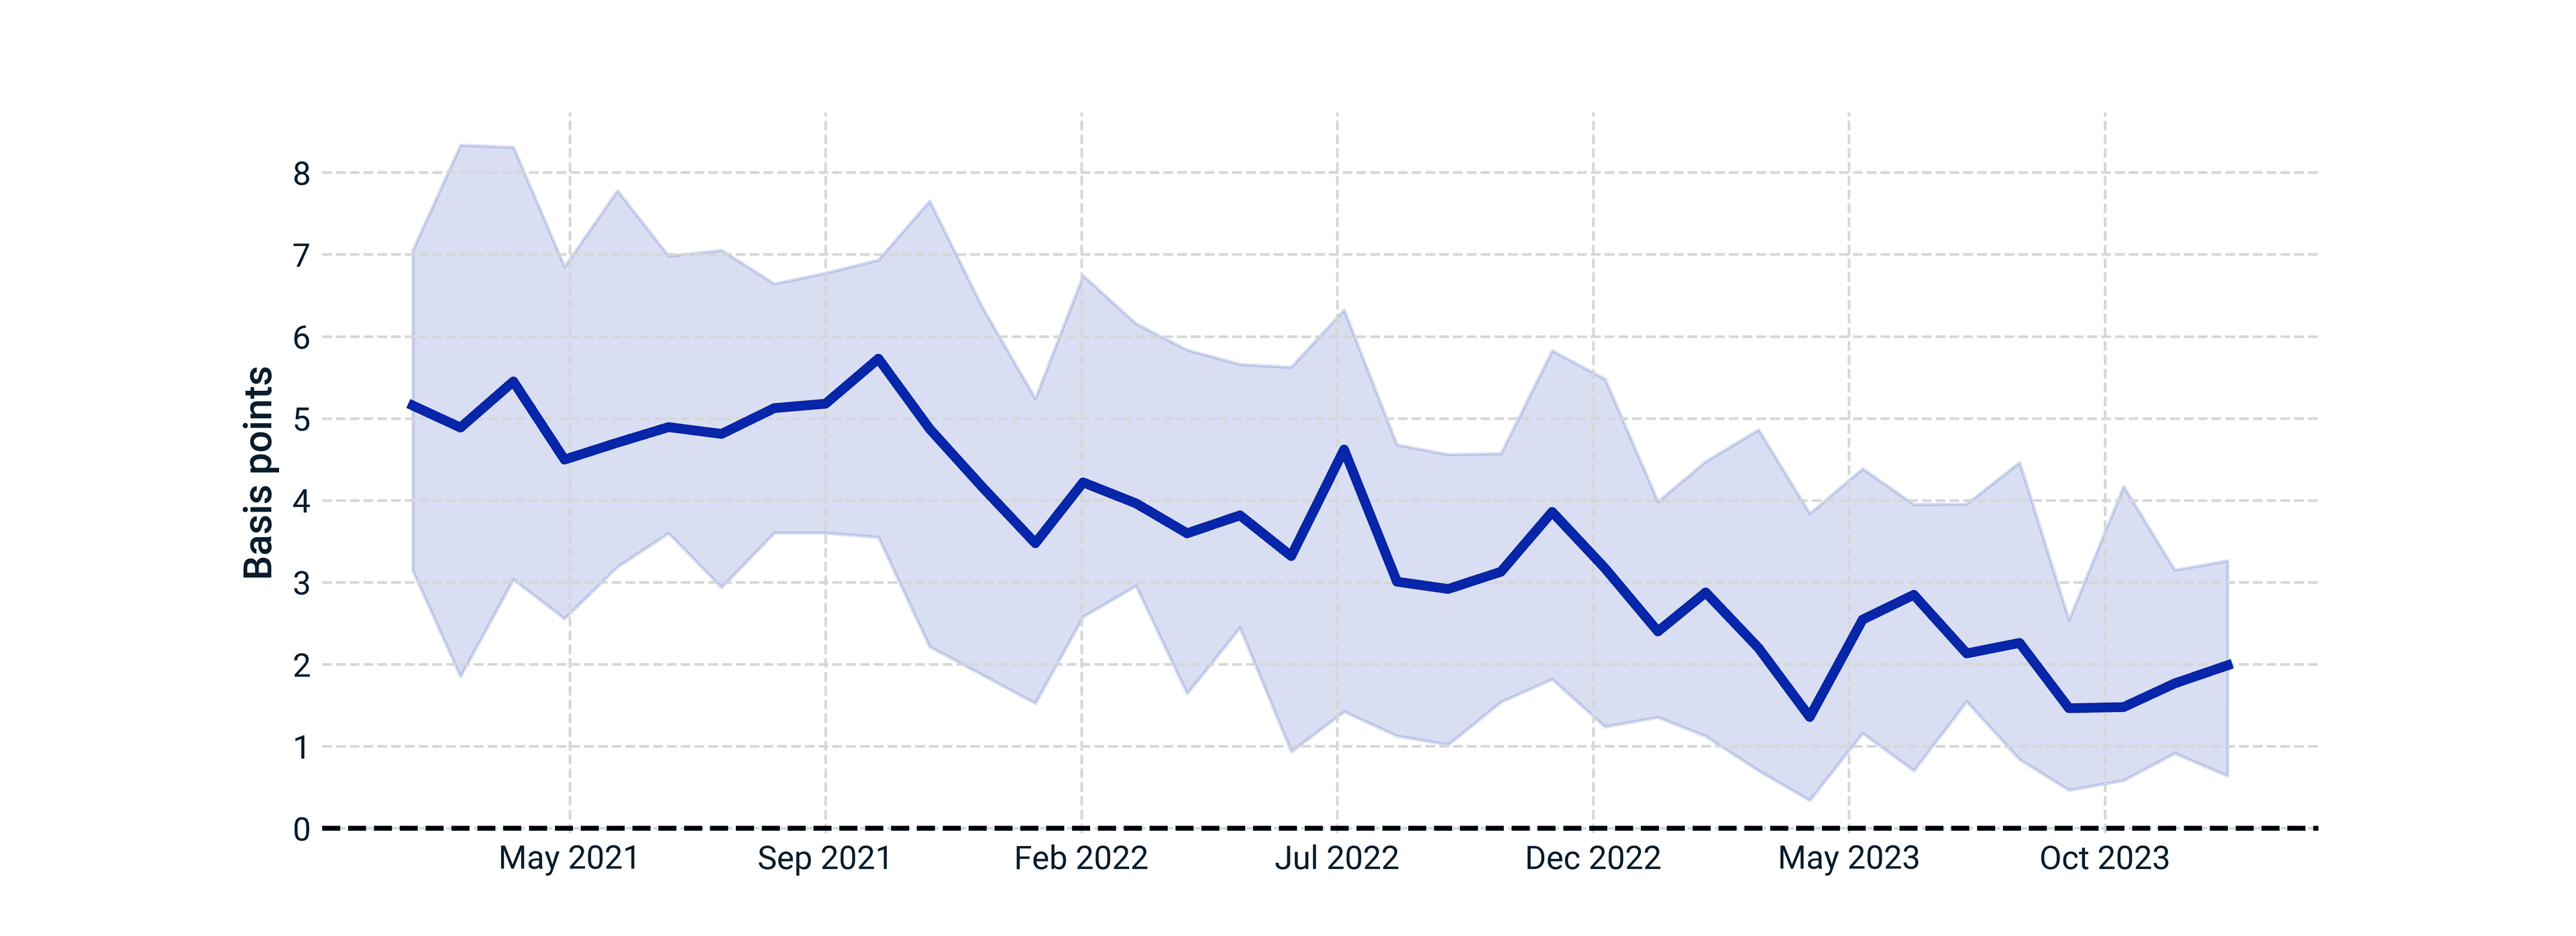
Line represents the median greenium; shade represents a 95% confidence interval. Analysis applied on 214 labeled bonds included in our study sample. Data as of Dec. 29, 2023.
In which corporate sectors was the greenium most pronounced?
In line with the overall labeled-bond market, financials and utilities were the most represented Global Industry Classification Standard (GICS®) sectors in our sample.[4] We found a pronounced and consistent 3- to 10-basis-point positive greenium in the utility sector, but labeled bonds from financials and the other sectors in our study did not exhibit a pronounced and consistent valuation premium.
Utilities are among the most carbon-intensive sectors, and so are at the forefront of efforts to decarbonize our economies. Labeled bonds are often directly linked to financing this transition, which could improve their issuers' risk profiles, incentivizing investors and leading these bonds to trade at a premium. Yet, as we argued in our study dedicated to labeled-bond issuers' cost of debt, the improvement of an issuer's environmental or social profile should not support greenium because both labeled and nonlabeled bonds should benefit equally from such improvement. Instead, the greenium could result from increased demand for labeled bonds to be included in sustainability-oriented investment strategies and products, and because of the relative greenness of these securities compared to conventional bonds for reporting purposes (e.g., in terms of financed emissions). For secondary-market investors, a consistent premium could imply overcrowding in the utilities sector's labeled bonds, as well as a lower relative value compared to the sector's conventional bonds or to labeled bonds in other sectors.
Greenium was most pronounced in utilities
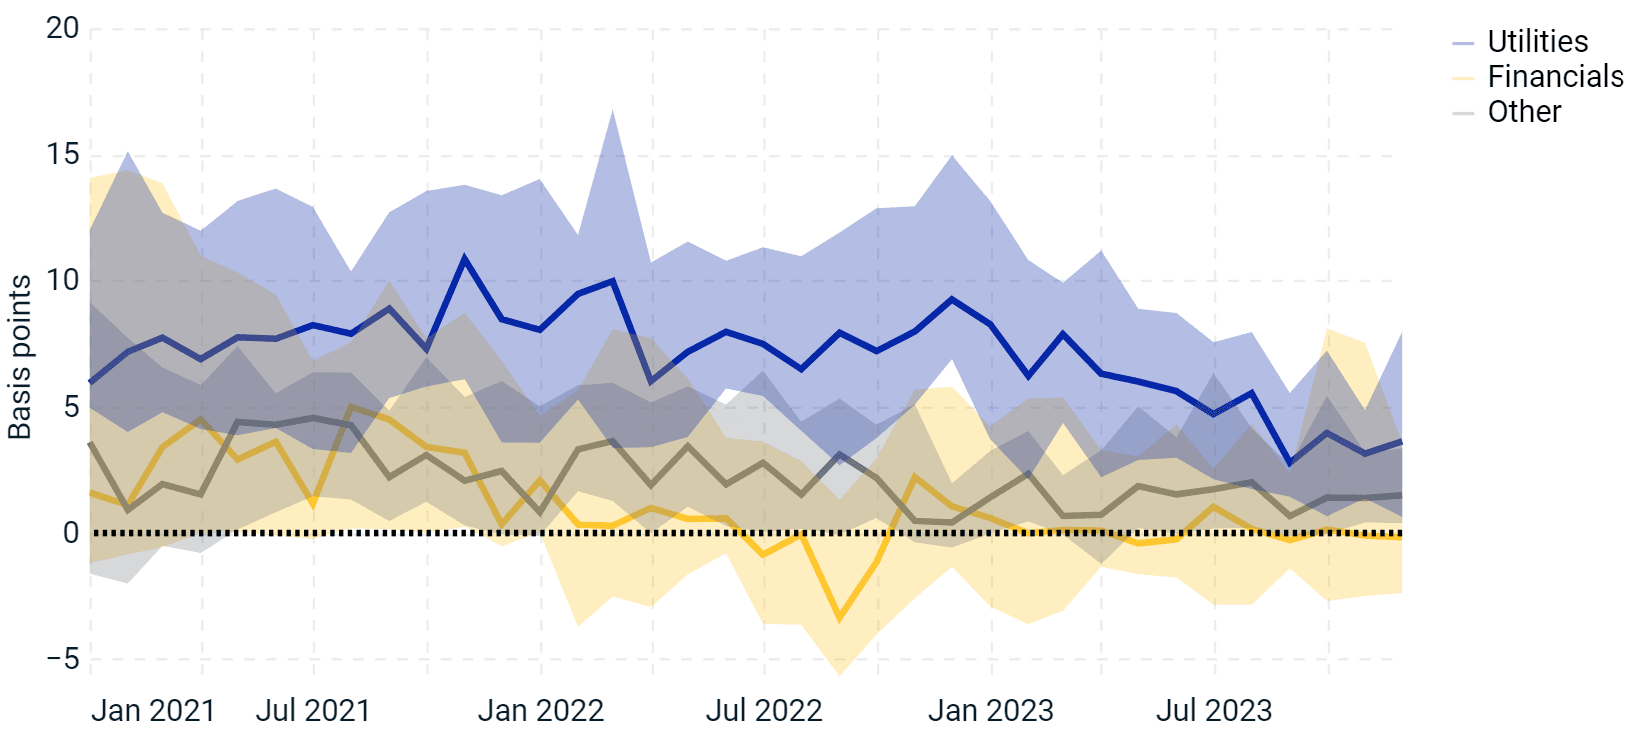
Lines represent the median greenium by sector; shades represent a 95% confidence interval. Data as of Dec. 29, 2023.
Persistent, but diminishing valuation premium
In conclusion, we confirmed the results of our 2020 study and found a persistent, albeit diminishing, greenium associated with USD-denominated labeled bonds. We noted that such a premium might change over time, potentially influenced by market paradigm shifts as the labeled-bond market matures. We also found differences among sectors, with utilities showing the biggest premium pricing of their labeled bonds. As more issuers from various sectors tap the market, however, we might see a change in this pattern. Interestingly, we have not found other bond characteristics, such as time since issuance or to maturity, to have had a significant impact on the observed results. Last, investors may find that applying a consistent approach to calculate greenium, such as using the issuer's yield curve, could help when trying to better understand its magnitude and changing dynamics over time.
The authors would like to thank Zach Tokura for his contributions to this blog post.


Subscribe todayto have insights delivered to your inbox.
1 Thomas K. Liaw, “Survey of Green Bond Pricing and Investment Performance,” Journal of Risk and Financial Management 13, no. 9, 2020.2 We omitted EUR-denominated bonds from our sample, as many of them were issued by financial companies and included senior preferred and nonpreferred bonds. As these bonds tend to trade at consistently lower and higher yields, respectively, they would consistently under- or overestimate the potential greenium when compared to a credit curve constructed from a mixture of these bond seniorities.3 Suzanne McGee, “U.S. Treasury bond ETFs draw net inflows this year despite recent market rout,” Reuters, Oct. 17, 2023.
Michael Mackenzie, Liz Capo McCormick and Denitsa Tsekova, “Beware the New Treasury Buyers Sparking Fear in World's Largest Bond Market,” Bloomberg, Oct. 13, 2023.4 GICS is the industry-classification standard jointly developed by MSCI and S&P Global Market Intelligence.
The content of this page is for informational purposes only and is intended for institutional professionals with the analytical resources and tools necessary to interpret any performance information. Nothing herein is intended to recommend any product, tool or service. For all references to laws, rules or regulations, please note that the information is provided “as is” and does not constitute legal advice or any binding interpretation. Any approach to comply with regulatory or policy initiatives should be discussed with your own legal counsel and/or the relevant competent authority, as needed.