
Macro Scenarios in Focus: Assessing Portfolio Resilience to AI and Geopolitical Risks
- Two macro risks dominate the market outlook: AI's potential economic disruption and energy-driven inflation from a fragile Persian Gulf ceasefire. We stress tested a global diversified portfolio against both.
- For multi-asset-class investors and allocators, combining top-down macro scenarios with bottom-up emerging-risk signals helps identify which companies and industries are most exposed under each scenario.
- Within equities, software and IT services are hardest hit in a disorderly AI transition, while energy producers benefit from a supply-side squeeze; no asset class is a safe haven across three regimes.
Mentioned in this blog post:
MSCI Supply Chain Intelligence | BarraOne | RiskMetrics RiskManager
Two forces dominate the current macroeconomic outlook: how AI reshapes the economy and what path inflation takes after a fragile Persian Gulf ceasefire. AI could deliver a productivity dividend, raising the economy’s sustainable growth path, or displace labor faster than it can be redeployed. The combatants could reach a durable ceasefire, or the conflict could re-escalate into another energy shock. We build three scenarios and translate each into a set of top-down macro shocks. We then sharpen them with bottom-up emerging-risk signals — the MSCI AI Disruption Potential dataset and metrics derived from MSCI Supply Chain Intelligence — that capture where each shock concentrates. With this combination of shocks, we stress test a global diversified portfolio. (Unlock the interactive chart below to drill down into various asset classes, align the asset allocation to your portfolio and modify the base currency.)
We examined two ends of the spectrum for AI’s economic impact. In the scenario of an AI productivity boom, AI is adopted across the economy faster than expected, raising productivity and lifting the sustainable growth path without adding to inflation.1 The gains come via faster real growth and price pressures stay close to baseline. The scenario of a disorderly AI transition presents the mirror image: Automation displaces labor faster than the economy can redeploy it, and falling labor income drives a demand-led recession.2 The damage falls unevenly on the most AI-exposed firms, and because displaced workers are slow to retrain, growth returns only slowly toward its pre-shock path.
Even if the attacks in the Persian Gulf cease for an extended amount of time, inflation may prove stickier than markets expect. Inflation is already elevated, and the energy-driven jump is unlikely to unwind quickly even if a deal resumes flows through the Strait of Hormuz.3 The scenario of a supply-side squeeze stress tests the tail: The combatants fail to reach a lasting ceasefire, energy prices rebound toward their conflict peak and a central bank focused on price stability has little room to ease into the shock.
We translated each scenario into a path for growth and inflation. The AI productivity boom lifts growth durably above baseline; inflation stays near baseline early and drifts modestly above it as growth runs hot. Both downside scenarios reach their lowest growth within the first year, with the disorderly AI transition falling furthest — into negative territory. Inflation falls in the demand-led disorderly AI transition but spikes toward 5% in the supply-side squeeze before receding.
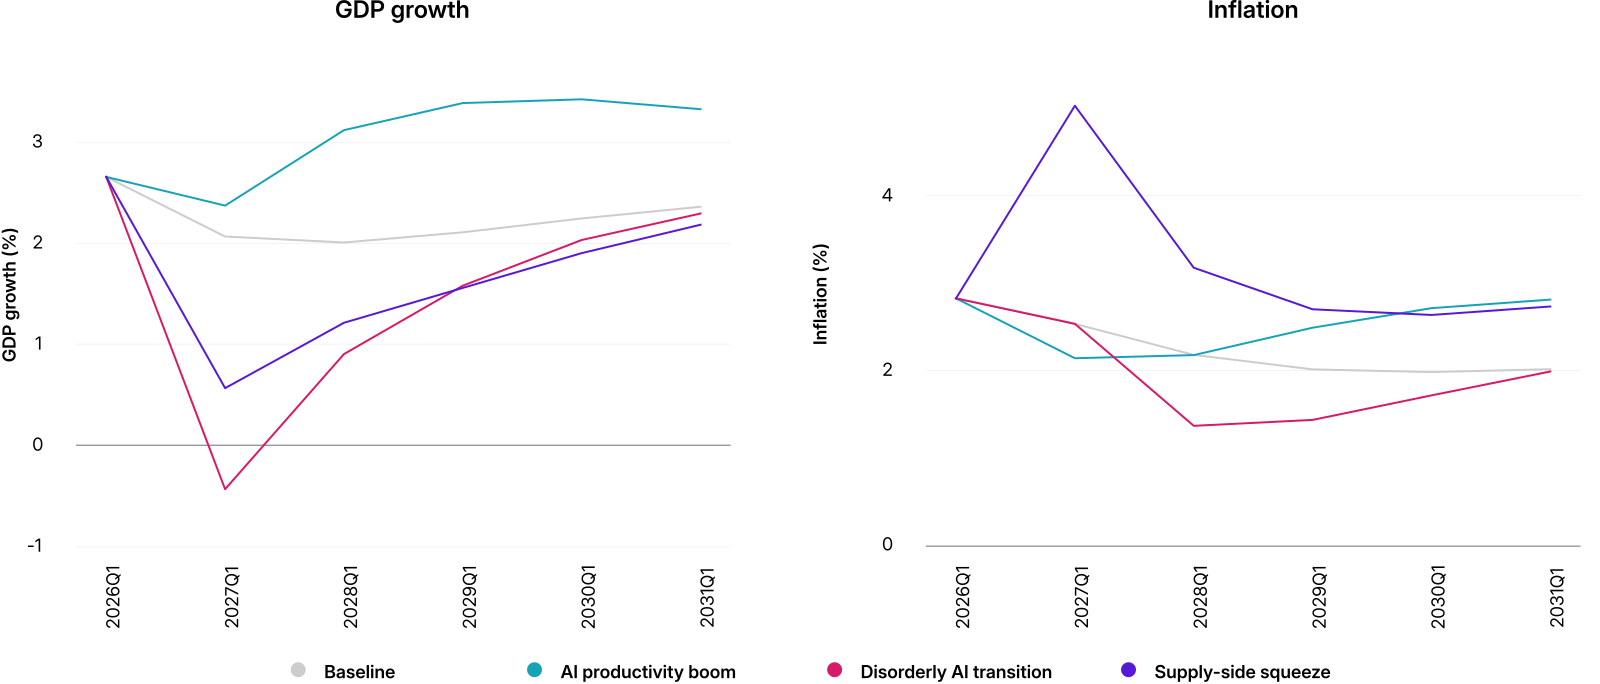
GDP and inflation paths were generated with the MSCI Macro-Finance Analyzer using the MSCI baseline scenario as of March 31, 2026. These are not forecasts, but hypothetical narratives of different macroeconomic scenarios.
The scenarios are macro narratives, but the resulting losses may concentrate in specific firms. Can we anticipate which firms are more exposed to these risks? Two episodes in early 2026 let us test it directly: The late-January software sell-off stood in for disorderly AI transition, and the first week of the Iran war for the energy shock.
We ranked stocks in the MSCI ACWI Investable Market Index (IMI) by MSCI emerging-risk signals. The AI Disruption Potential dataset scores how exposed each company is to automation, while Supply Chain Intelligence data is employed to measure impact on a company’s supply chains and gross profits if the Strait of Hormuz closes.4 We then examined whether the most exposed stocks did worse when the risk hit.5 In both episodes, more-exposed stocks underperformed on average. During the late-January software sell-off, the most AI-exposed quintile underperformed the least exposed by about 8 percentage points. In the first week of the Iran war, the most-Hormuz-exposed firms trailed by about 5 percentage points.
Average factor return by signal quintile; country-by-industry sub-portfolios from the MSCI ACWI IMI, shown net of the index return. Toggle between the AI-disruption view (late-January 2026 software sell-off) and the supply-chain view (Iran war's first week).
We shape each scenario's equity shock with the matching signal. In the disorderly AI transition, the shock hits the most automatable industries — sized to their late-January software-sell-off declines — across the U.S., developed markets ex-U.S. and emerging markets. In the supply-side squeeze, the Strait of Hormuz analysis lifts energy producers across the three regions, while the cyclicals most exposed to energy costs — airlines, autos and capital goods — fall, scaled to a renewed shock hitting depleted buffers.6
To assess the scenarios’ impact on multi-asset-class portfolios, we used MSCI’s predictive stress-testing framework and applied the shocks from the table below to a hypothetical global diversified portfolio, consisting of global equities, U.S. bonds and real estate.7
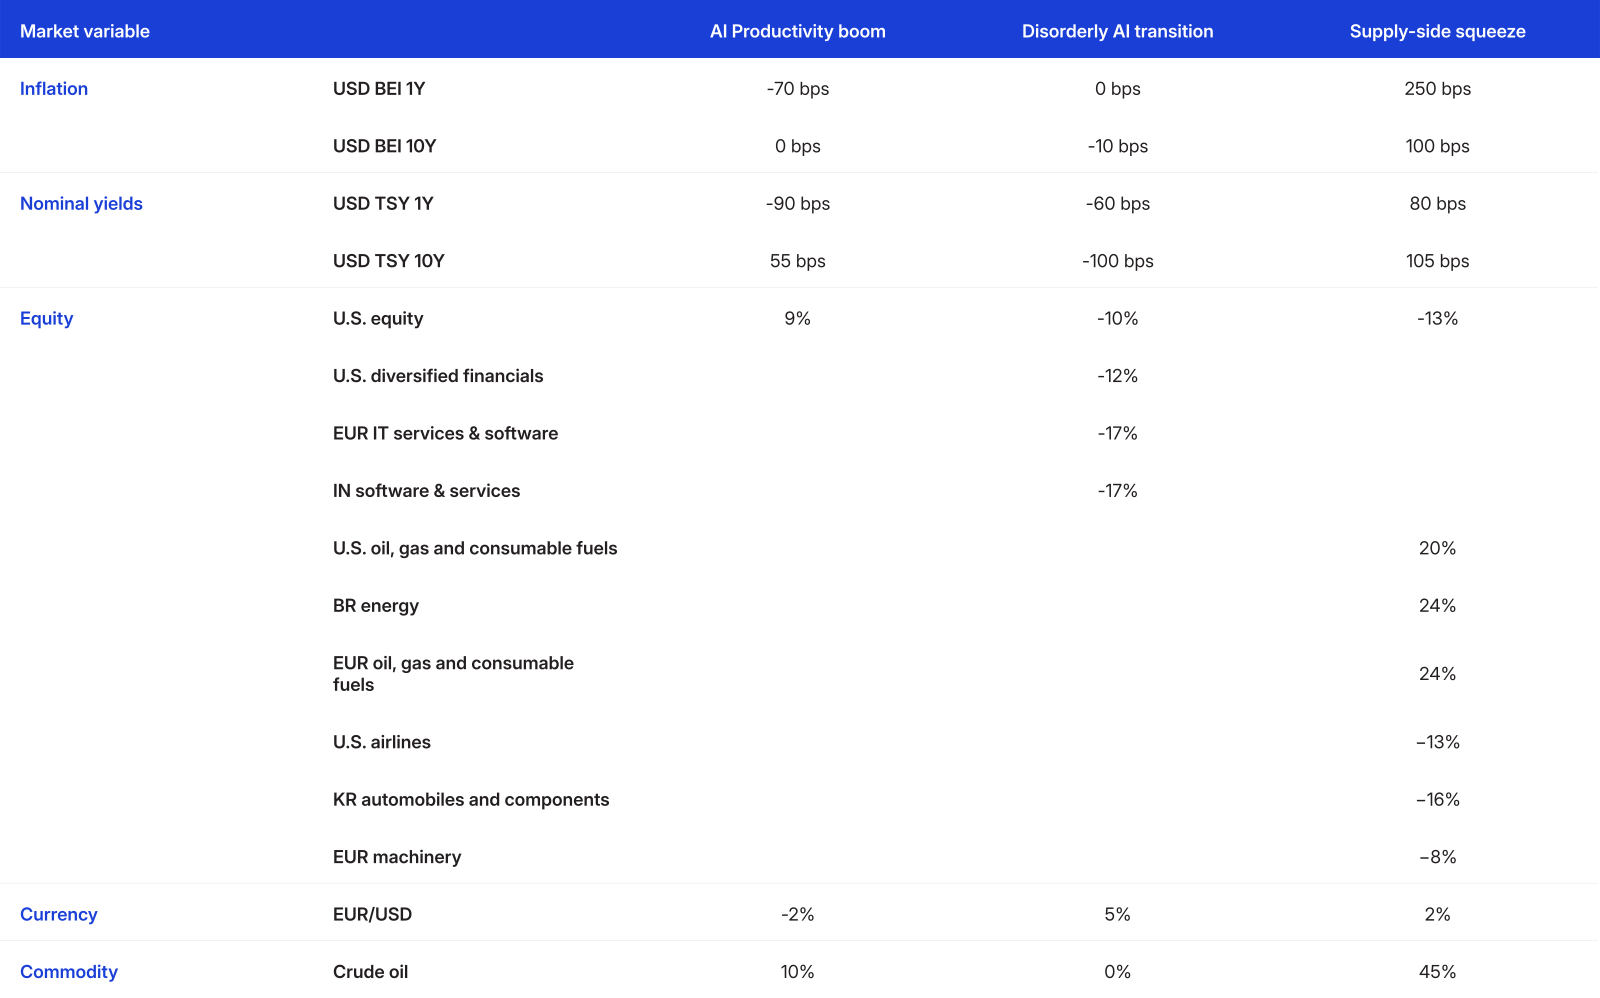
Assumptions about risk-factor shocks are informed by the MSCI Macro-Finance Analyzer and by analysis of historical data and judgment. Breakeven inflation (BEI) is measured in basis points (bps). This is not a forecast, but a hypothetical narrative of how the scenarios could affect multi-asset-class portfolios.
No asset class holds up across all three scenarios. The AI productivity boom lifts the portfolio about 3% on equity strength, though bonds detract as yields rise. The disorderly AI transition is the only regime where high-quality bonds hedge: Treasurys, investment-grade credit and TIPS rally, trimming the loss to about 2%. In the supply-side squeeze there is nowhere to hide: Equities and high-quality bonds fall together and the portfolio loses about 9%.
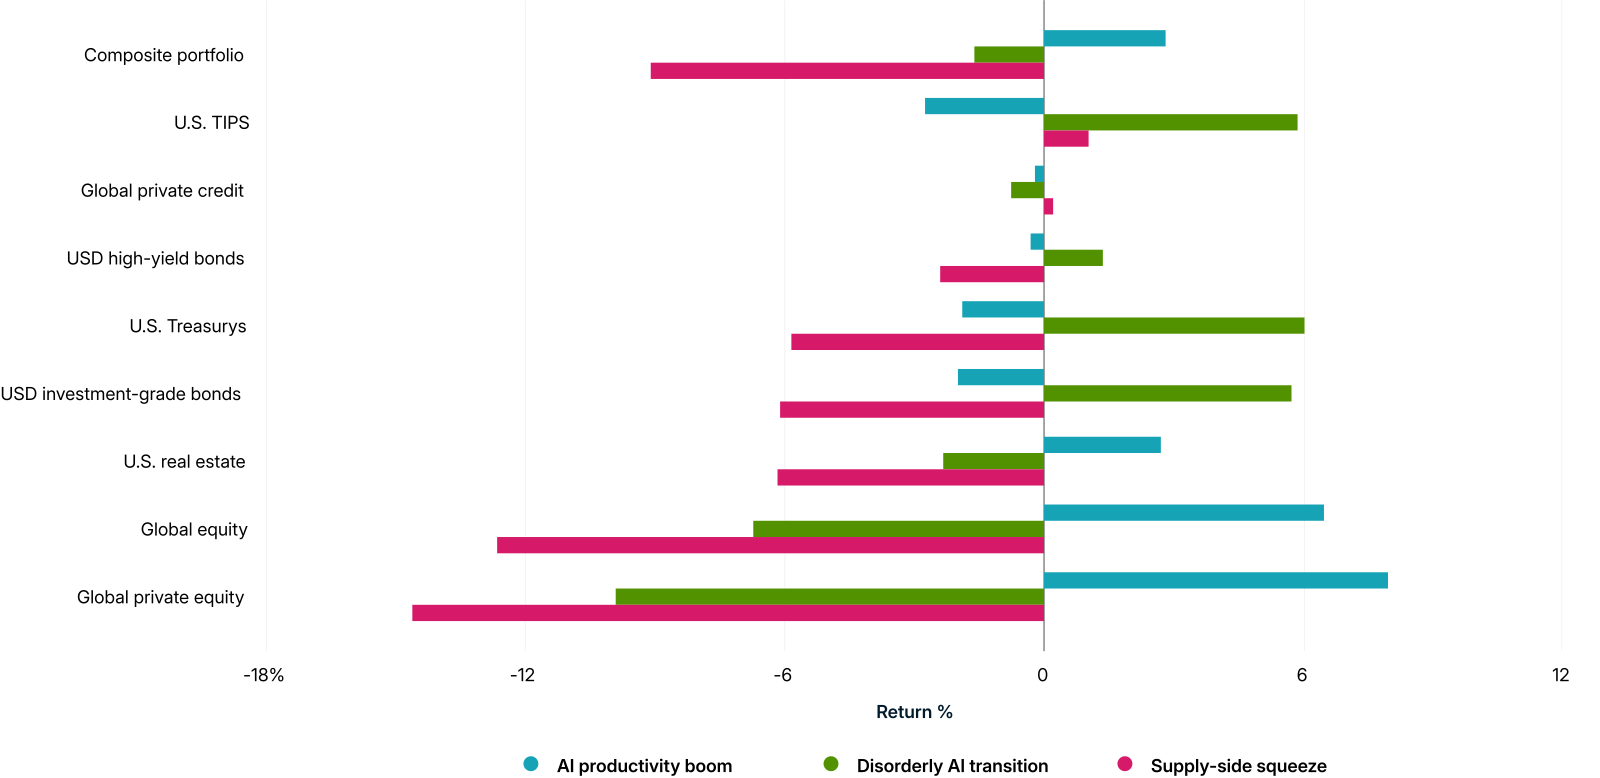
Portfolio impact of the scenario based on market data as of July 1, 2026. Source: S&P Global Market Intelligence, MSCI
The disorderly AI transition hits the software complex hardest: Software and IT services fall furthest in the U.S. and Canada (U.S. software −26%, IT services −23%), while semiconductors and hardware decline far less; and pharmaceuticals, oil and gas and independent power hold up or rise. The AI productivity boom is close to the mirror image — led by IT services, software and semiconductors in the U.S. and Canada.
The supply-side squeeze shifts the damage to energy-intensive and cyclical industries — semiconductors, electronic equipment, autos and airlines across the U.S., Japan and Germany — while oil and gas producers gain sharply.
The stress test is applied to the MSCI ACWI Index. The table shows results for select countries and GICS industries. Stress-test results as of July 1, 2026.
These are tail events, not base cases, but none of the asset classes we examined is a safe haven across all three regimes. To prepare for these tail risks, investors can combine a top-down macro model with bottom-up emerging-risk signals. The MSCI Macro-Finance Model describes the broad strokes, while emerging-risk signals refine the scenarios with industry-specific views of where each shock concentrates.
The authors thank Zsofia Dabi for her contributions to this blog post.




Subscribe todayto have insights delivered to your inbox.
Markets in Focus: AI’s Partners Become its Prey
U.S. software is being repriced as AI's next casualty — but with earnings forecasts still rising, the market may be moving far ahead of the disruption it fears.
Supply Chain Intelligence
Map Tier 1 and Tier 2 supply dependencies, identify exposures and concentration risk. Quantify how disruptions may affect companies.
1 “World Economic Outlook Update: Global Economy in the Shadow of War,” International Monetary Fund, April 2026.
2 Barhoumi, K. et al., "Global Economic and Financial Implications of Artificial Intelligence: Lessons from a Scenario-Planning Exercise," IMF Note 2026/002.
3 Claire Jones and Ian Hodgson, "Economists Bet on Higher Rates as Kevin Warsh Takes Reins at the Fed," Financial Times, June 16, 2026.
4 The Strait of Hormuz scenario assumes a three-month closure that blocks all maritime trade in and out of the Persian Gulf. For each company in the MSCI ACWI IMI universe, we measure exposure through three channels: (1) the share of the firm's sales shipped through chokepoint-affected routes, (2) the share of its direct tier-1 inputs coming through affected routes and (3) the share of its tier-2 inputs — its suppliers' suppliers — that are similarly affected. Quantity, output price and unit-cost shocks are computed per firm using elasticity assumptions on the effects of (1) input rationing on production, (2) global scarcity on price and (3) input-cost pass-through by firms. The model uses MSCI Supply Chain Intelligence to map each firm's operational footprint, suppliers and customers, producing indicative estimates of firm-level revenue, cost of goods and gross profit shocks. Ultimately, estimates of the gross-profit shock are employed as the firm-level financial-shock signal in this analysis.
5 The signal is built company by company, then mapped onto systematic country and industry factors. About half of the supply-chain signal and 80% of the AI signal turns out to be systematic, with the rest firm-specific. To test it, we group the index into country by Global Industry Classification Standard (GICS®, which is the industry-classification standard jointly developed by MSCI and S&P Dow Jones Indices) industry sub-portfolios (around 570), after dropping any bucket with fewer than three stocks. Each sub-portfolio gets a signal score (the size-weighted average of its holdings) and a systematic return over the stress window: the return implied by its factor exposures and the realized factor returns, expressed as an excess over the MSCI ACWI IMI return. We sort the sub-portfolios into quintiles by signal, and each bar is the average systematic return of all sub-portfolios in a quintile, so a rising or falling staircase shows the signal ranked winners and losers correctly.
6 For each scenario we shock a few industry factors rather than the whole cross-section, chosen for regional spread (U.S., DM-ex-U.S., EM), low mutual correlation, and each of them is among the most strongly signaled (regional index exposure × emerging-risk signal) in its region and is grounded by a realized episode: the Hormuz-chokepoint move for the supply-side squeeze and the SaaS-sell-off window paired with the AI-automation signal for the disorderly transition.
7 The results are generated by using model correlations to propagate shocks to the portfolios, using MSCI's BarraOne®. MSCI clients can download the correlated BarraOne stress test and RiskMetrics® RiskManager® stress test. Note that the above stress-test results capture the effect of repricing the assets, not the income component. Treasury inflation-protected securities (TIPS) are represented by the iBoxx TIPS Inflation-Linked Index provided by S&P Dow Jones Indices. U.S. Treasurys, equities and corporate bonds are represented by MSCI indexes. Private equity and private credit are represented by model portfolios. U.S. real estate is represented by the MSCI/PREA U.S. AFOE Quarterly Property Fund Index. The composite portfolio is 35% global public equities, 24% U.S. Treasurys, 2% TIPS, 12% U.S. investment-grade bonds, 2% U.S. high-yield bonds, 10% U.S. real estate and 15% global private assets (13% private equity and 2% private credit).
The content of this page is for informational purposes only and is intended for institutional professionals with the analytical resources and tools necessary to interpret any performance information. Nothing herein is intended to recommend any product, tool or service. For all references to laws, rules or regulations, please note that the information is provided “as is” and does not constitute legal advice or any binding interpretation. Any approach to comply with regulatory or policy initiatives should be discussed with your own legal counsel and/or the relevant competent authority, as needed.