
Mapping AI Exposure Across Global Markets
- AI leadership is more geographically distributed than narratives imply: Hardware favors Asia and Europe, digital infrastructure is globally contested and applications remain U.S.-led but are increasingly competitive.
- Outside the U.S., AI capital expenditure is broadly supported by sales growth. AI-exposed companies trade at a premium to domestic non-AI peers in most markets, but the shape of that premium varies.
- Geographies with a higher AI-value-chain score generally correlate to more positive analyst sentiment across both developed and emerging markets, and with stronger equity returns, particularly in emerging markets.
Mentioned in this blog post:
As AI reshapes corporate competitiveness, equity investors who allocate by country or markets may seek a systematic lens on AI exposure. It is increasingly important for these investors to understand which economies own the most critical nodes of the AI value chain and whether that ownership is reflected in valuations and analyst views.
We analyzed company business activities as they relate to AI and organized them across 10 components of the AI value chain, from chip manufacturing and model development to software deployment spanning across three different layers. We then measured each company's involvement across these components to derive an AI value chain exposure score, which we use to map AI exposure across geographies and assess competitive positioning within the MSCI ACWI universe.
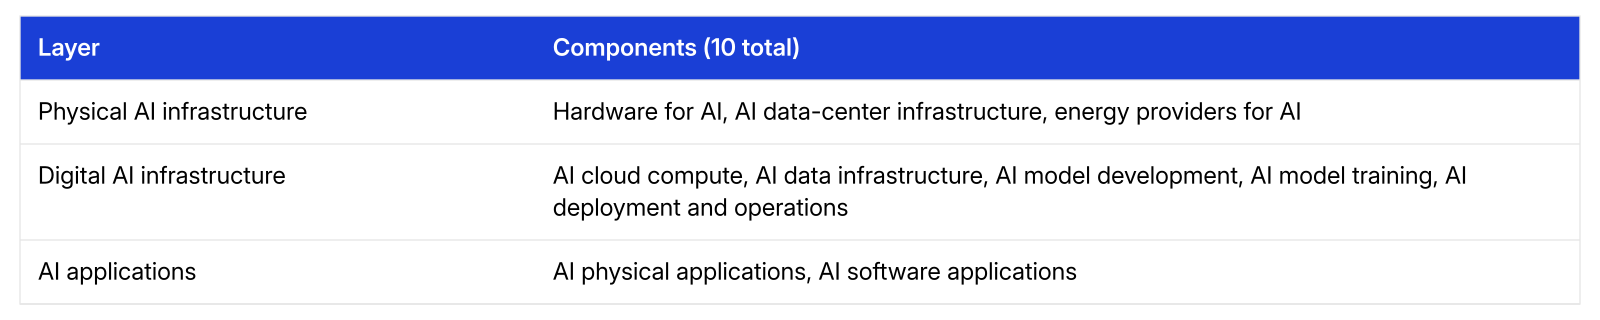
Each company is assessed for involvement in the AI value chain across 10 components representing the key nodes in the value chain, using segment revenue and attention from company news.
AI exposure is spread across geographies, with Taiwan and the Netherlands leading the overall rankings by index-weighted average AI-value-chain score, ahead of the U.S. To account for the possibility that a market's high score is driven by just a handful of firms, we also calculated a score adjusted by market concentration and the share of each market's universe with meaningful AI exposure (score >= 10). Contrary to the perception that AI exposure in Taiwan, the Netherlands and Korea is dominated by a handful of companies, these areas remained in the top tier across all three measures.
Competitive advantage is distributed unevenly across the three layers of the AI value chain and the geographic rankings shift markedly across them. In the physical layer, Taiwan's foundry scale, the Netherlands' lithography technology and Korea's strong position in memory chips together define hardware. Data-center infrastructure draws in the U.S., Taiwan and Ireland, reflecting the capital intensity and connectivity requirements of AI compute buildout, while energy provision adds France, Germany and the U.S., whose industrial power infrastructure has become increasingly relevant as electricity demand from AI workloads grows.
The digital layer is more contested: The U.S. leads in model training and China in the development of AI models, but the two are closely matched in cloud compute. The layer draws in a notably wide range of countries: Japan, Israel, Belgium, Germany, the U.K. and the Netherlands, pointing to genuinely contested competitive positions. In AI software applications, the U.S. leads, followed by China and Germany. Physical applications — spanning robotics, autonomous vehicles and industrial automation — tell a different story, with Germany and Korea emerging as strong challengers behind the U.S.
Data as of May 2026. AI-value-chain score adjusted by market concentration equals index-weighted average AI Value Chain Score * (1- HHI), where HHI is the Herfindahl-Hirshman Index, a standard measure of market concentration. Fraction of universe with meaningful AI-value-chain score is based on constituent count.
Investor concern about AI capital expenditure is well founded in aggregate, but a closer look reveals a more nuanced picture. The over-expenditure risk is, for now, a predominantly U.S. phenomenon: AI-exposed companies in the U.S. increased capital expenditure by nearly 60% over the year to May 2026, nearly ten times the 6% rate of domestic non-AI peers, with revenue growth a fraction of that pace.
Outside the U.S., the over-expenditure risk is much lower. Taiwan and China recorded strong growth in AI capex, with sales growth tracking closely, suggesting investment is being absorbed productively. Korea reflects a reallocation dynamic with AI investment growing modestly while non-AI peers contract. Japan is the only market where AI-exposed companies recorded negative capex growth, with Japan also seeing a small decline in AI sales.
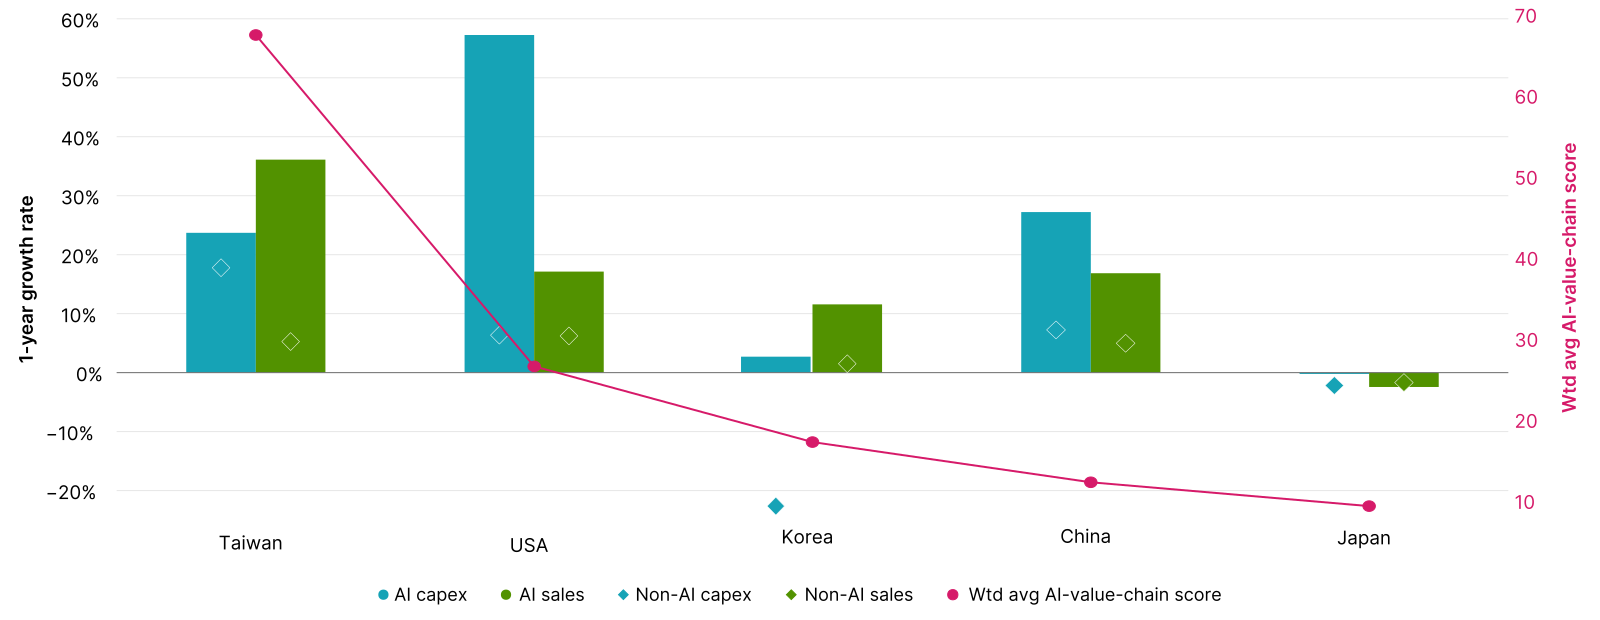
One-year growth rate of capital expenditure and sales for AI companies (AI-value-chain score >=10) and non-AI companies (AI-value-chain score <10). The AI-value-chain scores are as of May 2026, and the one-year growth rate is calculated between May 2025 and May 2026. Showing markets that have 10 or more companies with an AI-value-chain score >=10. Capital expenditure is estimated at the company level, some of which may be unrelated to AI.
That capital intensity is reflected in how markets are pricing AI companies. AI-exposed companies trade at a premium to domestic non-AI peers in nearly every market, but the size and shape of that premium vary across markets.
The price-to-book (P/B) and forward-price-to-earnings premia tell different stories across markets. Taiwan, the U.S. and Korea carry the largest P/B premiums reflecting markets assigning high value to the physical asset base underpinning hardware and data centers, with current valuations roughly 3x non-AI peers. China and Japan follow a similar pattern at more moderate levels. For Taiwan and the U.S., the relative forward-P/E premium is more modest, consistent with AI companies' earnings advantage over domestic non-AI peers being already well established and priced in, rather than contingent on future acceleration. Korea is a notable extreme: a high P/B premium alongside a forward P/E lower than 1, meaning AI-exposed companies in Korea are priced at a discount to domestic non-AI peers on earnings expectations.
Where a market sits in the AI value chain determines not just whether it commands a valuation premium, but what kind of premium.
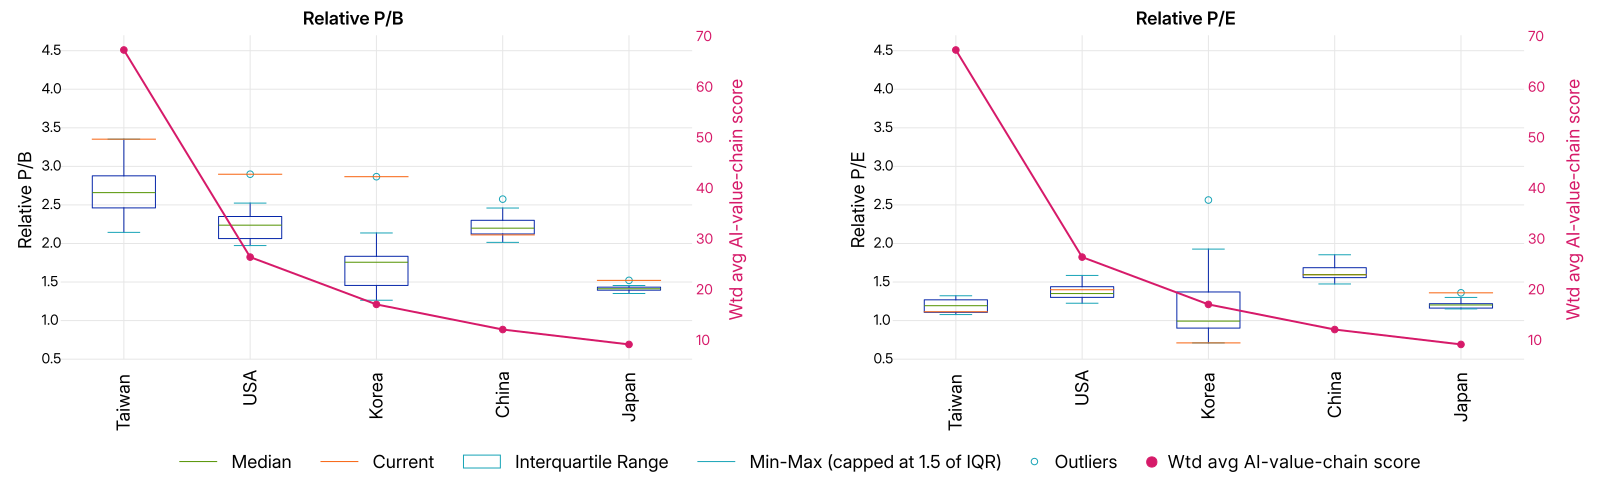
Weighted average valuations (harmonic mean for P/B and forward P/E) for AI companies (AI-value-chain score >=10) relative to non-AI companies (AI-value-chain score <10). The box plots show the distribution of these relative multiples across 12 quarterly snapshot dates from August 2023 to May 2026, with the current reading (May 2026) highlighted in red. Showing markets having 10 or more companies with AI Value Chain Score >=10.
To assess AI's impact on markets, we examined analyst sentiment as a forward-looking indicator of AI positioning, and equity returns as evidence that exposure has translated into performance.
Geographies with higher AI-value-chain scores are associated with more positive analyst views: the Netherlands and the U.S. in developed markets, Taiwan and Korea in emerging markets. Analysts have a more muted view of China, likely balancing its AI credentials against macro and geopolitical risk.
The relationship between AI-value-chain scores and equity returns was particularly pronounced in emerging markets, where Taiwan's hardware centrality and Korea's role in supplying memory chips for AI compute have driven strong performance over the past year.
Weighted average AI-value-chain score mapped against analyst sentiment and one-year returns for developed and emerging markets. One-year performance ending in May 2026. Bubble size reflects market weight in the MSCI ACWI Index.
The AI value chain is more geographically distributed than is commonly perceived. No single economy dominates end to end. For country allocators, the relevant question is not which market leads, but where each market competes in the chain, and whether that position is reflected in valuations, capex trends and investor sentiment.


Subscribe todayto have insights delivered to your inbox.
Markets in Focus: AI’s Partners Become its Prey
U.S. software is being repriced as AI's next casualty — but with earnings forecasts still rising, the market may be moving far ahead of the disruption it fears.
Where are companies across the AI value chain really investing?
Companies across the AI value chain account for roughly 42% of global R&D spending, far outpacing their shares of revenue, earnings and capex, highlighting R&D as a key competitive driver.
The content of this page is for informational purposes only and is intended for institutional professionals with the analytical resources and tools necessary to interpret any performance information. Nothing herein is intended to recommend any product, tool or service. For all references to laws, rules or regulations, please note that the information is provided “as is” and does not constitute legal advice or any binding interpretation. Any approach to comply with regulatory or policy initiatives should be discussed with your own legal counsel and/or the relevant competent authority, as needed.