MBS prepayment in 2020: Looking back, looking ahead
- Structural changes taking place over many years in U.S. mortgage finance, along with the massive rate rally since the end of 2018, led in part to 2019's refinancing wave.
- In 2019, steeper prepayment risk tiering increased the complexity of modeling and the need for more advanced analytical techniques.
- We identified three potential prepayment themes for 2020: Refinancing burnout could set in; payup value of collateral with call protection may erode; and a further rate rally could lead to an even stronger refinance wave.
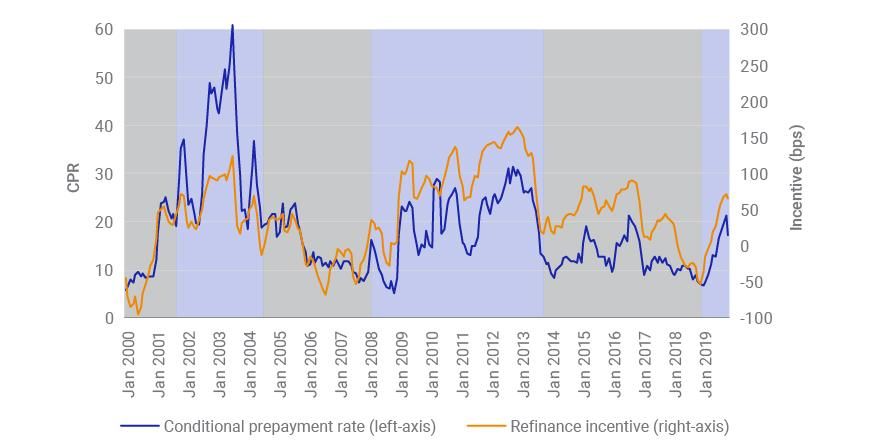
- 2000-2001: The conditional prepayment rate (CPR) line was in sync with the incentive line, which was below 50 bps. This period of time has often been regarded as benchmark years for refinance efficiency.
- 2002-2004: The CPR line soared above the incentive line, indicating extraordinarily efficient exercise of prepayment options for borrowers.
- 2005-2007: Aggregate incentive dropped below 50 bps, with the two lines mostly overlapping. The prepayment during this period was dominated by base prepayment speeds.
- 2008-2013: During the end of the financial crisis and in its aftermath, the prepayment line was substantially lower than the incentive line (which mostly stayed above 100 bps), due in part to tighter underwriting standards. The period witnessed unconventional policymaking, such as quantitative easing and the Home Affordable Refinance Program (HARP).
- 2014-2018: After years of refinance burnout — with lowered borrower participation in HARP and the downward drift of the weighted-average gross coupon (WAC) — prepayment decreased significantly in this period, especially as quantitative easing turned to tightening in 2017. Nevertheless, the prepayment line mostly remained below the incentive line.
- 2019: The gap between the prepayment and incentive lines narrowed meaningfully, indicating higher refinancing efficiency.
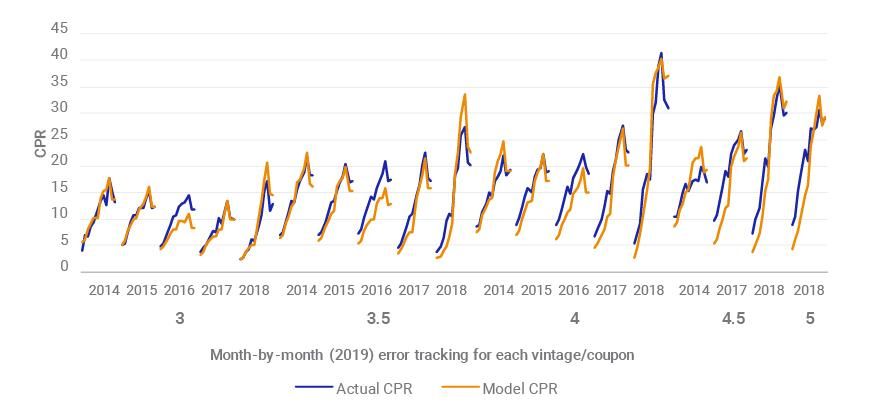
- In 2020, if rates stay range-bound — e.g., +/- 40 bps — refinance burnout may start to kick in, with the caveat that further underwriting efficiency could offset the burnout. The model provided some conditional and initial information that certain cohorts (e.g., 4s 2018) might have already shown signs of burnout in November, when the slowdown exceeded the implied change due to seasonality, day count and rate changes.
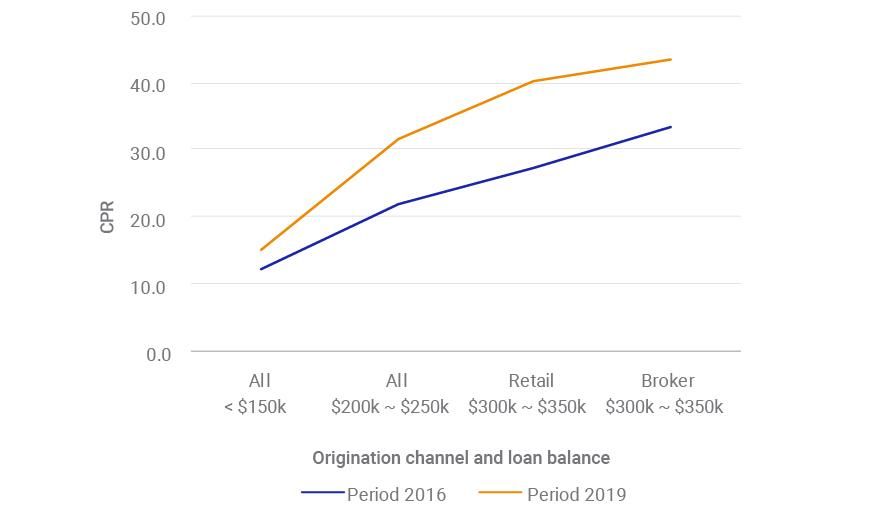
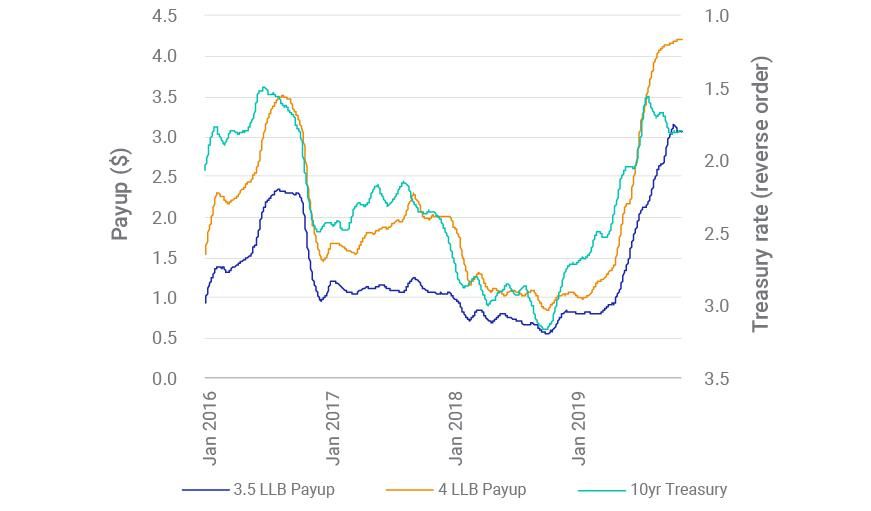
- Payup value of collateral with call protection may erode (i.e., a lower FICO score or lower loan balance), as mortgage originators broaden their refinance solicitation. The limited origination capacity was demonstrated by primary-secondary spread widening. As the proportion of more reactive and profitable borrowers shrink, originators may ramp up their efforts targeting the slower-prepayment subset of the mortgage universe.
- If rates rally in 2020, it may result in an additional refinancing trend — especially among the 2019 vintage of mortgages, which constitute the cheapest-to-deliver subset, with a high share of refinance loans, as well as of loans originated through brokers and with PIW eligibility and higher loan balances.
Coupon | Vintage | UPB ($B) | WAC | FICO | OLTV | Loan Balance ($k) | 2019 CPR | 2020 CPR |
3.00 | 2019 | 166 | 3.90 | 757 | 77 | 338 | - | 8.0 |
None | 2016 | 174 | 3.65 | 761 | 75 | 310 | 10.4 | 13.6 |
None | 2013 | 103 | 3.58 | 764 | 72 | 296 | 9.2 | 11.2 |
None | 2012 | 75 | 3.58 | 770 | 71 | 305 | 9.1 | 10.9 |
3.50 | 2019 | 117 | 4.39 | 745 | 80 | 311 | - | 18.8 |
None | 2017 | 136 | 4.06 | 756 | 78 | 298 | 13.1 | 19.1 |
None | 2016 | 75 | 4.07 | 739 | 78 | 267 | 14.5 | 18.7 |
None | 2015 | 110 | 4.10 | 752 | 77 | 281 | 14.0 | 17.3 |
None | 2012 | 81 | 3.99 | 760 | 74 | 265 | 10.9 | 13.4 |
4.00 | 2019 | 64 | 4.84 | 732 | 80 | 286 | - | 29.8 |
None | 2018 | 139 | 4.64 | 748 | 79 | 298 | 24.1 | 35.7 |
None | 2017 | 96 | 4.46 | 734 | 79 | 267 | 17.4 | 27.3 |
4.50 | 2018 | 71 | 5.11 | 722 | 81 | 256 | 23.2 | 35.7 |

Subscribe todayto have insights delivered to your inbox.
The content of this page is for informational purposes only and is intended for institutional professionals with the analytical resources and tools necessary to interpret any performance information. Nothing herein is intended to recommend any product, tool or service. For all references to laws, rules or regulations, please note that the information is provided “as is” and does not constitute legal advice or any binding interpretation. Any approach to comply with regulatory or policy initiatives should be discussed with your own legal counsel and/or the relevant competent authority, as needed.