Real estate may be yielding less than you thought

Blog post
September 12, 2019
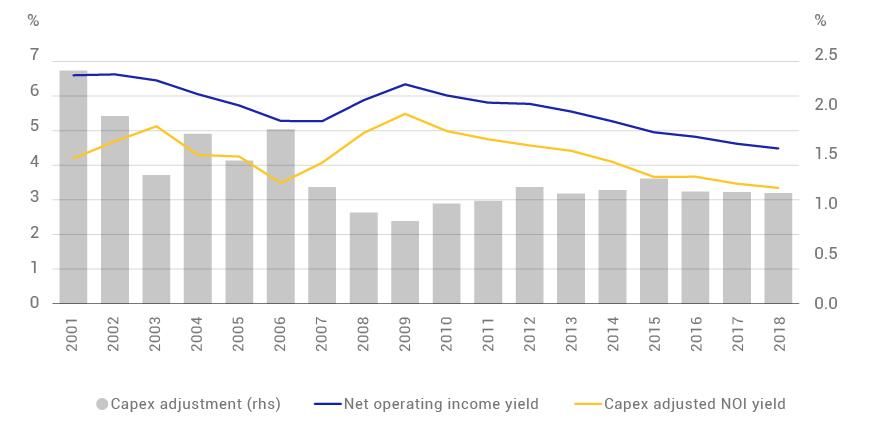
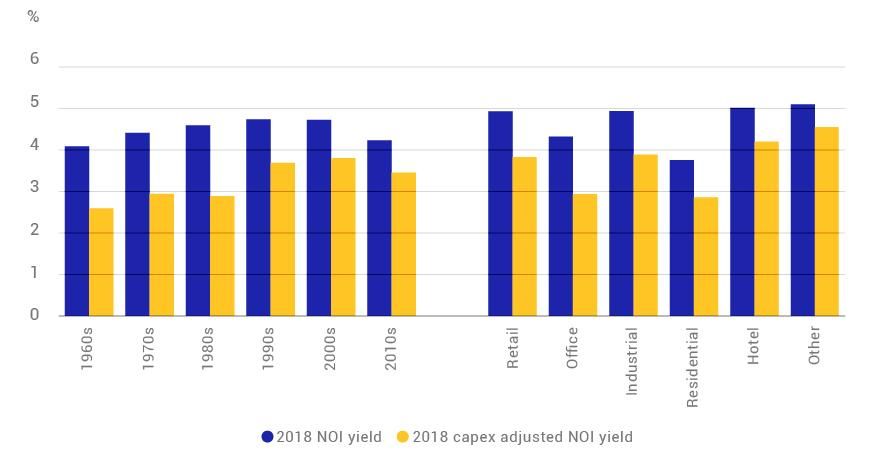
  • Income is an important part of real estate returns, meaning yields are often heavily scrutinized by investors. But headline yields often do not factor in capital-expenditure (capex) requirements.
  • Variables such as age, location and property type can influence how much capex is required to operate an asset.
  • Investors looking to understand the potential "free cash flow" position of assets or portfolios post-capex may want to adjust the yields they use to account for it.
As the old adage goes, you have to spend money to make money. This is certainly true of real estate, where capital expenditure (capex) is required to maintain and operate a portfolio. But do investors fully appreciate how much capex their portfolios require? This may help them gain a better understanding of the income profile of their portfolios.
The importance of income to real estate investors
For example, over its 18-year history, the MSCI Global Annual Property Index has achieved an annualized total return of 7.4%, 5.7% of which was income return. The fact that income accounted for such a sizable proportion of the long-term total return helps illustrate why income returns and yields have often been highly scrutinized as part of the investment process. However, real estate assets are physical buildings requiring ongoing capital investment. Investors may therefore, in certain circumstances, want to look beyond headline income returns and yields to better understand the "free cash flow" position of their assets or portfolios after capex.
Adjusting for capex
We used data from the MSCI Global Annual Property Index to demonstrate the effect of adjusting net operating income (NOI) yields to account for the amount of capex. Between 2001 and 2018, the adjusted NOI yield averaged around 130 basis points (bps) lower than the headline NOI yield (see exhibit below). So, while the headline NOI yield achieved by commercial real estate in 2018 was 4.4%, a capex-adjusted measure of NOI yield registered around 110 bps lower, at 3.3%.
Capex-adjusted yields trend lower than headline yields
It is also worth noting that capex has been lower since the global financial crisis. So, while we've seen record-low headline yields every year since 2014, capex-adjusted yields are still only just below their 2006, pre-financial-crisis lows.
How much capex?
The amount of capex for assets can vary due to things like the property type, country and asset age. This is illustrated in the exhibits below, which use 2018 data from the MSCI Global Annual Property Index to compare NOI yields against capex-adjusted NOI yields. The first notable observation is that the adjustment for older assets was larger than for newer assets (which is understandable, given older buildings can require more maintenance expenditure). Thus, while assets built in the 1960s and the 2010s had NOI yields of 4.1% and 4.0%, respectively, after adjusting for capex, the gap was much wider with 1960s and 2010s buildings, yielding 2.5% and 3.4%, respectively. We can also see that at the headline level, NOI yields for office assets in 2018 were 4.2% — 60 bps higher than for residential assets. However, after factoring in capex, the adjusted yields for office were 2.9%, only slightly higher than the 2.8% for the residential sector.
The magnitude of capex adjustment can vary considerably
2018 NOI yield and 2018 capex adjusted NOI yield
Moving to a country level, the exhibit below compares the national markets within the MSCI Global Annual Property Index. While Australia's NOI yield was relatively high in 2018 at 5.2% (and at a similar level to Portugal), after adjusting for capex, Australia was more comparable to some of the European markets like Italy and France, both of which yielded 3.5%.
Location can also matter as capex levels vary across countries
Country
Net Operating Income Yield
Capex Adjusted NOI Yield
Country

South Africa

Net Operating Income Yield

7.9%

Capex Adjusted NOI Yield

6.6%

Country

New Zealand

Net Operating Income Yield

5.8%

Capex Adjusted NOI Yield

3.0%

Country

Belgium

Net Operating Income Yield

5.6%

Capex Adjusted NOI Yield

5.0%

Country

Poland

Net Operating Income Yield

5.5%

Capex Adjusted NOI Yield

4.8%

Country

Hungary

Net Operating Income Yield

5.3%

Capex Adjusted NOI Yield

4.5%

Country

Portugal

Net Operating Income Yield

5.2%

Capex Adjusted NOI Yield

4.9%

Country

Australia

Net Operating Income Yield

5.2%

Capex Adjusted NOI Yield

3.5%

Country

Czech Republic

Net Operating Income Yield

4.8%

Capex Adjusted NOI Yield

3.5%

Country

Ireland

Net Operating Income Yield

4.7%

Capex Adjusted NOI Yield

4.2%

Country

Norway

Net Operating Income Yield

4.5%

Capex Adjusted NOI Yield

3.3%

Country

Canada

Net Operating Income Yield

4.5%

Capex Adjusted NOI Yield

2.6%

Country

Japan

Net Operating Income Yield

4.4%

Capex Adjusted NOI Yield

4.0%

Country

UK

Net Operating Income Yield

4.4%

Capex Adjusted NOI Yield

3.7%

Country

US

Net Operating Income Yield

4.4%

Capex Adjusted NOI Yield

2.8%

Country

Spain

Net Operating Income Yield

4.3%

Capex Adjusted NOI Yield

3.3%

Country

Austria

Net Operating Income Yield

4.1%

Capex Adjusted NOI Yield

3.6%

Country

Italy

Net Operating Income Yield

4.1%

Capex Adjusted NOI Yield

3.5%

Country

South Korea

Net Operating Income Yield

4.0%

Capex Adjusted NOI Yield

3.9%

Country

Netherlands

Net Operating Income Yield

4.0%

Capex Adjusted NOI Yield

3.6%

Country

France

Net Operating Income Yield

4.0%

Capex Adjusted NOI Yield

3.5%

Country

Germany

Net Operating Income Yield

3.9%

Capex Adjusted NOI Yield

3.4%

Country

Sweden

Net Operating Income Yield

3.7%

Capex Adjusted NOI Yield

2.3%

Country

Switzerland

Net Operating Income Yield

3.6%

Capex Adjusted NOI Yield

3.1%

Country

Denmark

Net Operating Income Yield

3.6%

Capex Adjusted NOI Yield

2.9%

The above examples help to demonstrate how capex adjustments can have a sizable impact on yields and that various factors like age, location and property type can influence the size of the impact. For those familiar with listed real estate markets where metrics like adjusted funds from operations (AFFO) — a measure of financial performance — are sometimes used, the practice of adjusting for recurring capex may not be a new concept for some investors. But applying a similar approach at the asset level has the potential to help investors differentiate net operating cashflows from free cash flows. This may help them to better understand the income profile of their direct real estate investments.
Further Reading

Subscribe today
to have insights delivered to your inbox.

The content of this page is for informational purposes only and is intended for institutional professionals with the analytical resources and tools necessary to interpret any performance information. Nothing herein is intended to recommend any product, tool or service. For all references to laws, rules or regulations, please note that the information is provided “as is” and does not constitute legal advice or any binding interpretation. Any approach to comply with regulatory or policy initiatives should be discussed with your own legal counsel and/or the relevant competent authority, as needed.