
Reassessing the Case for Japanese Equities
- The MSCI Japan Index has outperformed the MSCI Kokusai (World ex Japan) Index by 16.4% since the start of 2025, coinciding with the 10-year Japanese government bond (JGB) yield reaching its highest level since 1996.
- Higher yields have historically accompanied stronger Japanese equity returns (in USD) from 2000-2026. Yen depreciation has also supported local equity market returns, given the export-oriented nature of the Japanese economy.
- For investors acting tactically on Japan exposure, the choice of index involves a trade-off between market coverage and liquidity.
Mentioned in this blog post:
MSCI Japan Index | MSCI Kokusai (World ex Japan) Index | MSCI Japan IMI Index
MSCI Japan had a similar return profile to MSCI Kokusai between 2001 and 2008, then underperformed by 58.4% cumulatively from December 2008, bottoming out in January 2025. It has since outperformed by 16.4% (gross USD returns). The reversal came against a backdrop of significant changes in Japan's macroeconomic environment as well as corporate behavior. The Bank of Japan abandoned yield curve control in 2024 and ended negative rates, closing out three decades of near-zero policy rates. The Tokyo Stock Exchange's initiative encouraging listed companies to improve capital efficiency and market valuations accelerated a shift in corporate behavior, visible in rising payouts.1
Our analysis examines the macro conditions supporting a tactical allocation to Japan and the differentiated exposure it may offer.
Higher yields have come with stronger equity returnsThe 10-year JGB yield stands at 2.94% as of August 2026, its highest level since September 1996, and the Bank of Japan's policy rate of 1.25% now sits at its highest since 1995.2 The OECD projects the rate reaching 2% by the end of 2027, citing higher inflation expectations, solid nominal wage growth and the closing of the output gap.3 A higher yield in Japan may signal stronger nominal growth and corporate pricing power. Japanese financials, which account for roughly 19% of the index, have been among the biggest beneficiaries, earning wider net interest margins as rates normalize.
We tested the relationship between yield changes and Japanese equity returns historically by bucketing monthly USD returns into quintiles based on the change in the 10-year JGB yield. The pattern is fairly monotonic. The lowest quintile, when yields fell most, averaged -0.9%, while the highest averaged 1.5%.
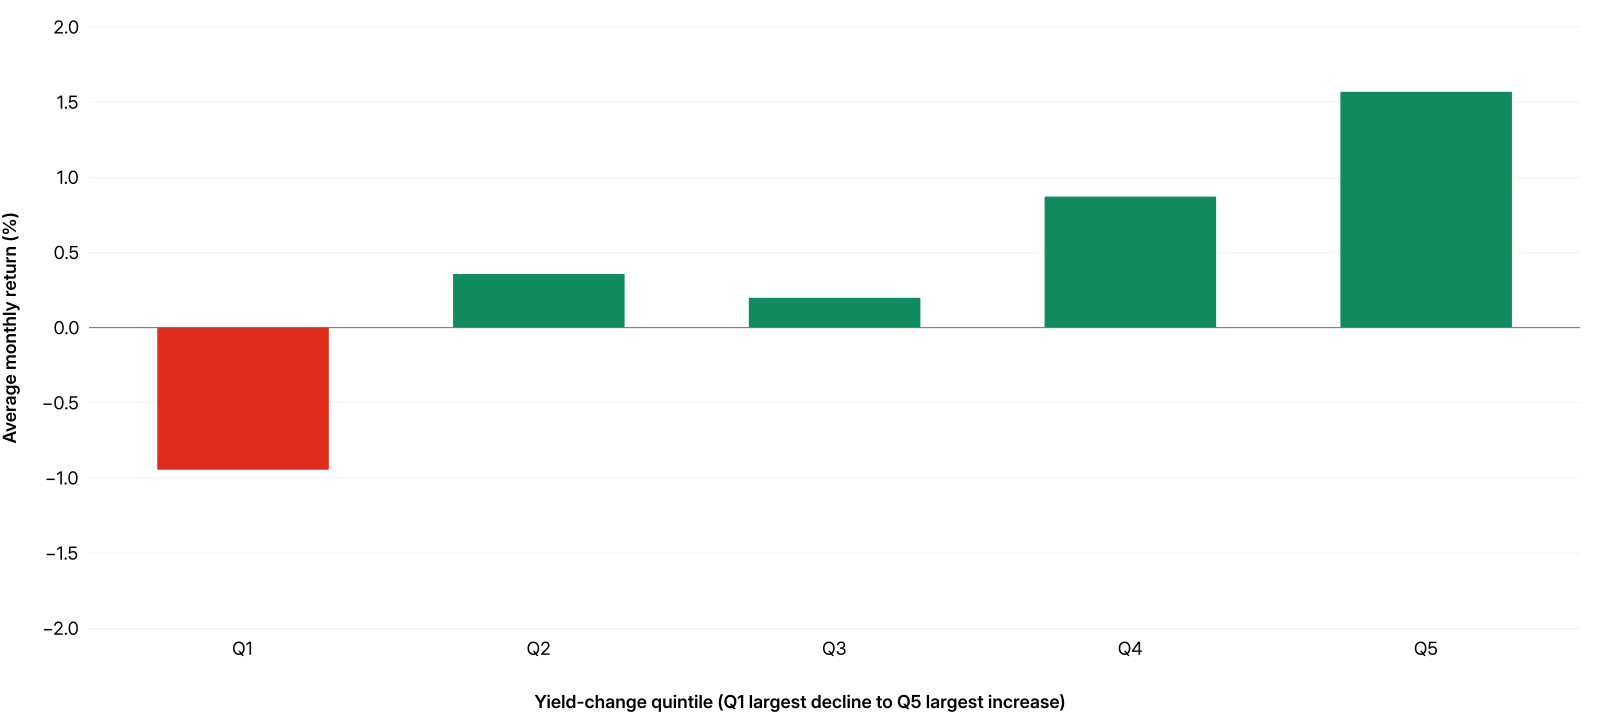
Time period: January 2000 to July 2026. Average monthly gross returns in USD for MSCI Japan Index, bucketed by the contemporaneous monthly change in the 10-year JGB yield. Q1 represents the largest declines and Q5 the largest increases.
Japanese firms derive 56.8% of revenue from outside Japan, against 48.2% for the MSCI Kokusai Index using MSCI Economic Exposure data.4 The export-oriented nature of the Japanese economy makes yen weakness a key return driver. A quintile analysis based on how far the yen sits from its 36-month average shows strong returns in the two weakest quintiles and negative returns in the two strongest.
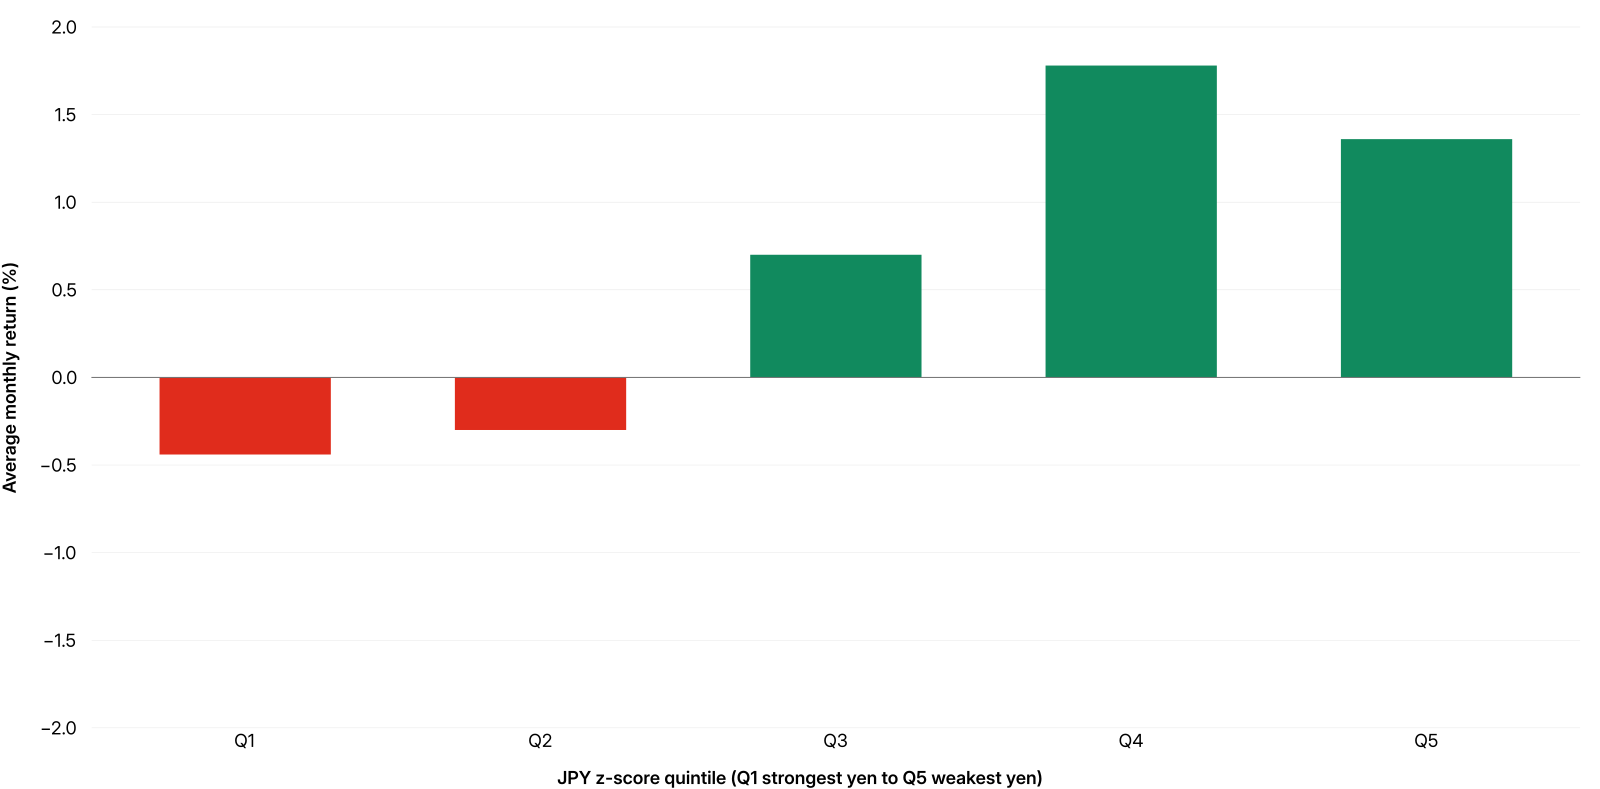
Time period: January 2000 to August 2026. Average monthly gross returns in JPY for the MSCI Japan Index, bucketed by a z-score calculated as the deviation of USD/JPY spot from its trailing 36-month mean in standard deviations.
Japan's sector mix — as defined by the Global Industry Classification Standard (GICS®)5 — diverges from those of MSCI Kokusai. Although industrials, financials and information technology are the three largest sectors in both the MSCI Japan and MSCI Kokusai indexes, their relative importance is very different. Industrials are the largest sector in Japan at roughly 25% of the index, more than twice their 10% weight in Kokusai. Conversely, information technology accounts for around 18% of Japan, compared with more than 30% of Kokusai.
The industry composition within each sector differs markedly between the two indexes. Financials has a similar weight in both, yet banks account for almost two-thirds of Japan's financial sector, compared with less than half in Kokusai. Semiconductors and semiconductor equipment represent around half of information technology in both markets, but Japan has relatively more technology hardware and less software and services. The differences within industrials are also notable: Japan has greater representation in machinery, trading companies and industrial conglomerates, while aerospace and defense is more prominent in Kokusai.
The plot shows the industry weights within each of the GICS sectors for MSCI Japan and MSCI Kokusai (World ex Japan) Index as of Aug. 31, 2026.
Much of Japan's semiconductor equipment, robotics and precision component exposure sits under industrials rather than information technology, so a sector view understates how much of Japan is linked to the technology cycle. On a revenue basis, exposure to the MSCI AI value-chain exceeds 7%, below the U.S. but above Europe, spanning physical AI infrastructure, digital AI infrastructure and applications.
Fundamentals: improving, but the relative picture is mixedJapan's corporate fundamentals send mixed signals. Dividend payouts have increased while the profitability gap with the rest of the developed world has widened. MSCI Japan yielded 50 to 150 basis points (bps) less than MSCI Kokusai for two decades until 2019. Since then, Japan has yielded more: around 25 bps as of August 2026.
MSCI Japan traded at a forward earnings premium to MSCI Kokusai until roughly 2013 and at a discount since. The discount has narrowed over the past year to -2.3. The price-to-book discount has gone the other way, reaching its widest reading of -2.3 in the series.
Japan's return on equity has improved in absolute terms, from around 9% to roughly 12%, but Kokusai's has risen faster based on margin expansion among the largest U.S. technology companies.
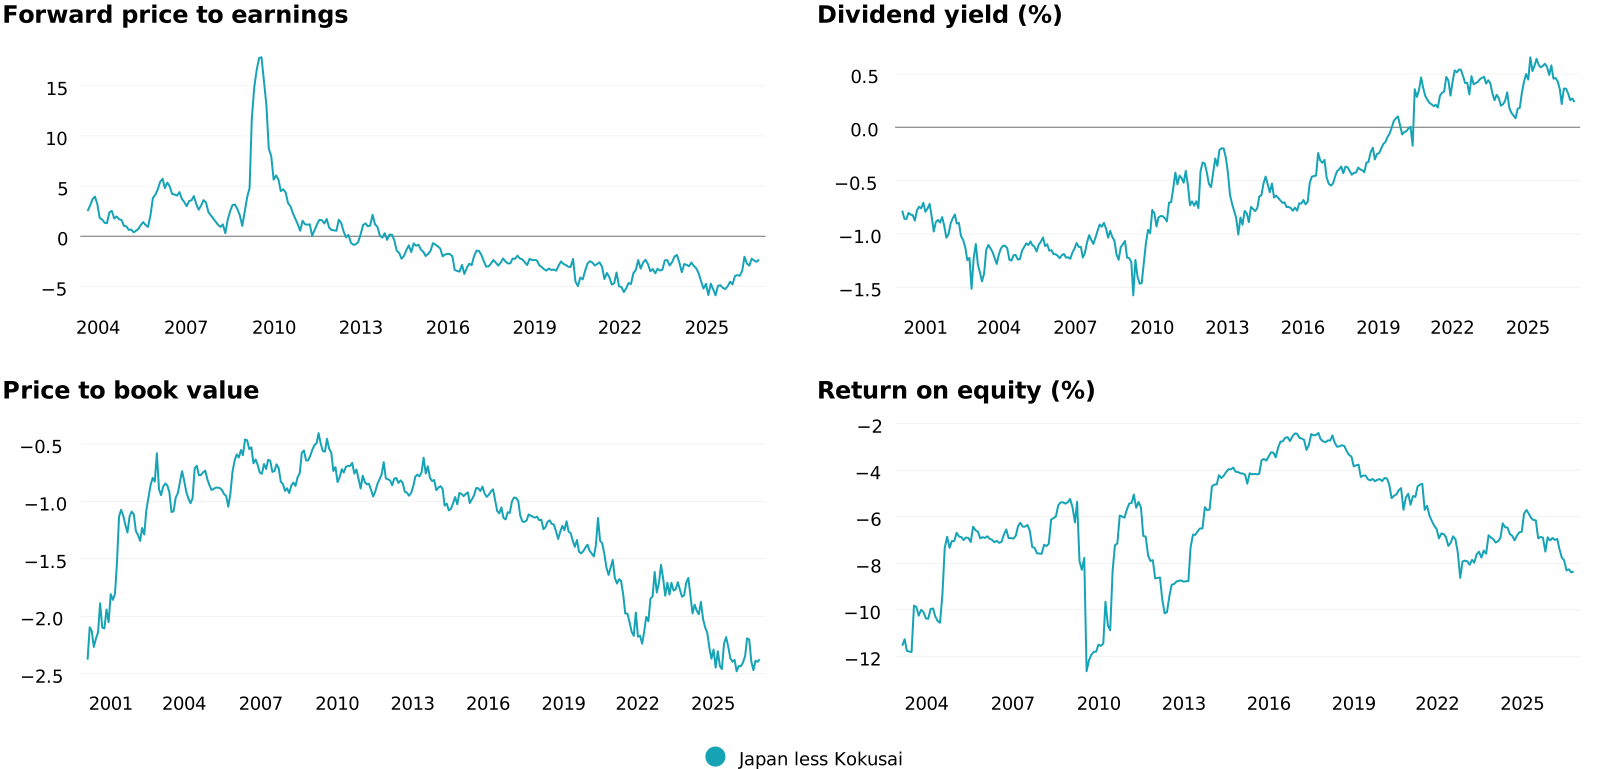
Time period: December 1998 to August 2026. The spread for each metric is calculated as the difference in metric values, MSCI Japan Index less MSCI Kokusai Index (World ex Japan), on each date.
Investors can choose from a range of underlying indexes to express their investment strategy and asset allocation decisions for the broader Japanese market. Over the long term, the MSCI Japan IMI™ Index has outperformed MSCI Japan, highlighting the value in looking beyond large- and mid-cap companies when considering broad Japanese equity-market exposure. The extent to which investors reach into the small-cap segment, however, varies across indexes.
MSCI Japan covers large- and mid-cap companies, while MSCI Japan IMI includes small-cap companies as well and is built to represent 99% of the investable market, so its number of constituents moves with the market itself. The MSCI Japan Select 700 Index currently sits between the two, reaching into small caps but with a fixed number of constituents.
The differences in coverage have not translated into large differences in historical risk and return. On tradability, the Japan Select index resembles MSCI Japan. Assuming USD 10 billion in assets, the maximum days to trade for Japan Select 700 is 5.8 — the same as MSCI Japan — against 8.1 for Japan IMI.
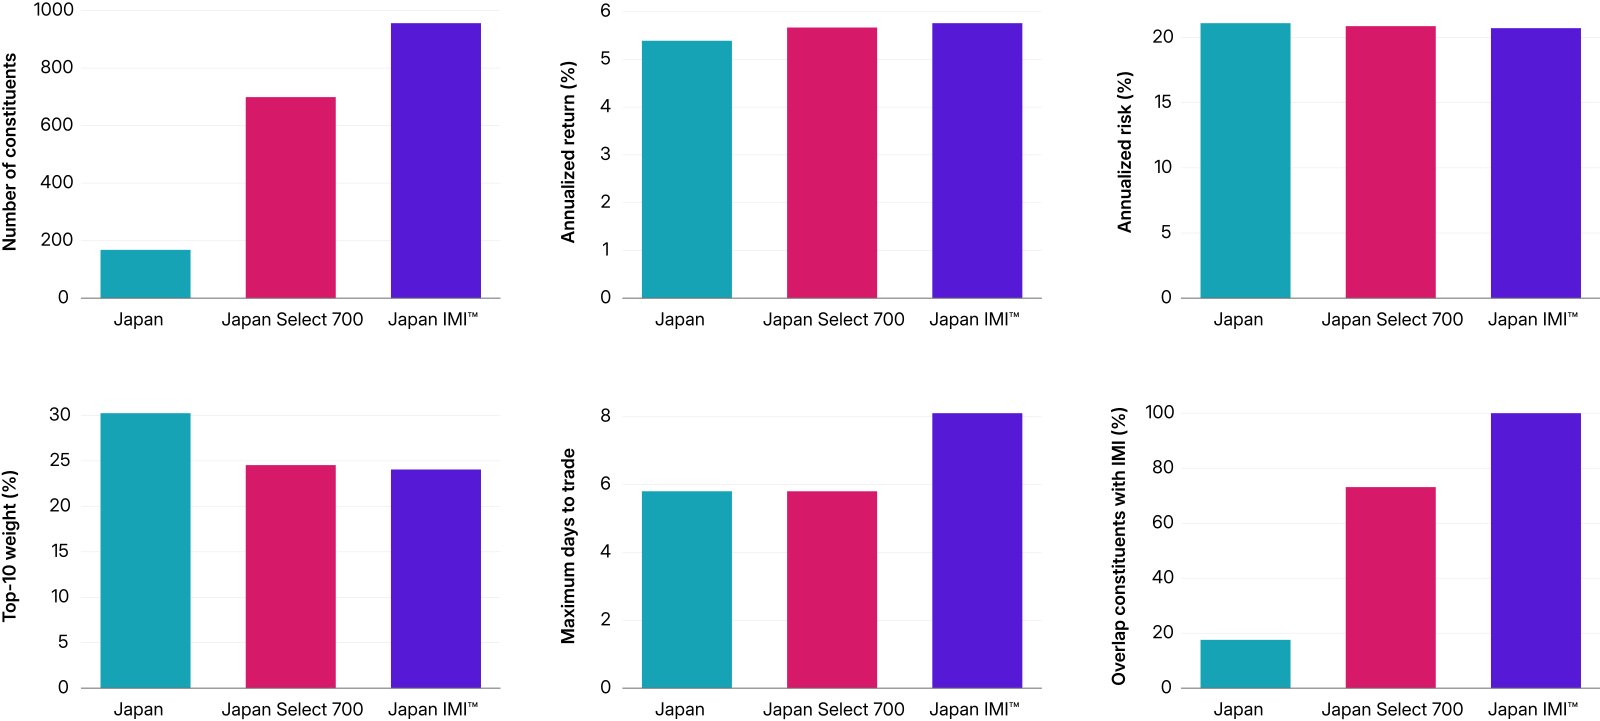
Return and risk: Dec. 31, 1998 – Aug. 31, 2026, gross returns, annualized in USD. Number of constituents and top 10 weight as of Aug. 31, 2026. Maximum days to trade relative to cash, USD 10 billion, 20% ADV. Overlap constituents with IMI (%) is the number of constituents an index shares with MSCI Japan IMI, expressed as a percentage of MSCI Japan IMI constituents.
For higher-frequency changes in tactical allocation or hedging effected through index futures, the liquidity of the underlying basket is core to determining how quickly, and at what cost, an investor's position can be built or unwound. The macro case for Japan remains intact; which index an investor uses to express it is now the more relevant decision.


Subscribe todayto have insights delivered to your inbox.
Developed Markets Indexes
The MSCI Developed Markets Indexes are designed to consider variations reflecting conditions across regions, market-cap segments, sectors and styles.
Economic Exposure in Global Investing
Market capitalization-based indexes classify companies based on their country or region of domicile. This approach, however, does not reflect the sources of constituent's revenues.
Mapping AI Exposure Across Global Markets
AI's geography is more distributed than headlines suggest — we map which economies lead each layer of the value chain and what that means for global equity investors.
1 Tokyo Stock Exchange, Inc., "Request to Encourage Management to be More Conscious of Cost of Capital and Stock Prices," The Eighth Council of Experts Concerning the Follow-up of Market Restructuring, Document 3, February 15, 2023,
2 CNBC, "Bank of Japan raises interest rates to 31-year high, flags concerns over inflation," September 17, 2026.
3 OECD, "Key Policy Insights," in OECD Economic Surveys: Japan 2026 (Paris: OECD Publishing, 2026)
4 Using MSCI Economic Exposure data, we assess the portion of a company's global revenues from markets and regions worldwide.
5 GICS is the industry-classification standard jointly developed by MSCI and S&P Dow Jones Indices.
The content of this page is for informational purposes only and is intended for institutional professionals with the analytical resources and tools necessary to interpret any performance information. Nothing herein is intended to recommend any product, tool or service. For all references to laws, rules or regulations, please note that the information is provided “as is” and does not constitute legal advice or any binding interpretation. Any approach to comply with regulatory or policy initiatives should be discussed with your own legal counsel and/or the relevant competent authority, as needed.