
The Performance Record of Control Skew in US IPOs
- U.S. IPOs with unequal voting rights (control skew) have shown weaker average shareholder returns and sharper drawdowns since 2011 than companies with more equitable voting rights, though outcomes vary widely.
- For risk and portfolio construction teams, this shows up most starkly in the downside: 79% of multiple-class companies saw drawdowns exceeding 70% peak-to-trough, against 50% of single-class peers.
- Multiple-class structures have gone from rare to routine. In 2021, 71% of qualifying IPOs carried control skew, making share structure a relevant input for any IPO investor.
SpaceX’s June IPO is the first in what is likely a new wave of founder-controlled megacap offerings expected to carry significant control skew.1 It comes at the end of a decade of IPOs with this characteristic, providing a dataset to examine the relationship between ownership structure and shareholder returns.
Between 2011 and 2021, 63 U.S.-domiciled companies raised at least USD 1 billion in their public market debuts. Technology firms made up the largest share, including Meta Platforms Inc., Snap Inc. and Airbnb Inc., with financial services, industrials and healthcare companies making up most of the remainder.
In 2014, not one company in the dataset went public with a multiple-class share structure, but by 2021, 71% approached the market with two or more classes with different voting entitlements. Across 2019 to 2021, 63% of this cohort were controlled via such structures, up from 32% in the prior seven years.2
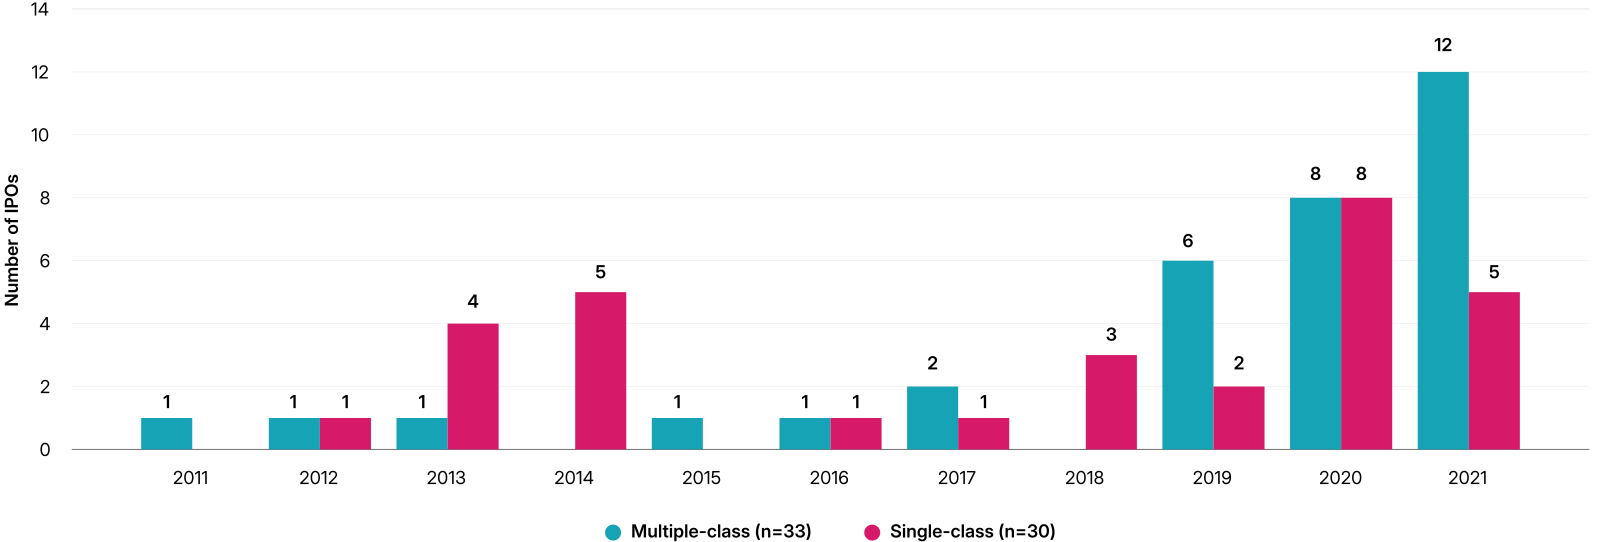
Multiple-class is defined as any instance where different classes of shares are issued and outstanding that carry differing voting rights on a per-share basis. Source: FactSet, MSCI Sustainability & Climate. MSCI Sustainability & Climate products and services are provided by MSCI Solutions LLC in the United States and MSCI Solutions (UK) Limited in the United Kingdom and certain other related entities.
Separating economic and voting rights lets a controlling shareholder, often the founder, retain decision-making control while sharing upside with public shareholders. In many cases, the founder’s vision is treated as an asset that short-term market pressure could otherwise dilute, with control skew serving as a protective mechanism. The trade-off for minority shareholders is economic exposure, be it upside or downside, without commensurate voting rights.
To measure this voting misalignment, we use the ownership-control alignment ratio (OCA), which is a controlling shareholder’s economic ownership percentage divided by their percentage of voting rights.3 An OCA below 1.0 indicates control skew. Of the 33 companies with multiple share classes in the cohort, 30 carried an OCA below 1.0 at listing, and most had no sunset clause to restore voting parity over time.4
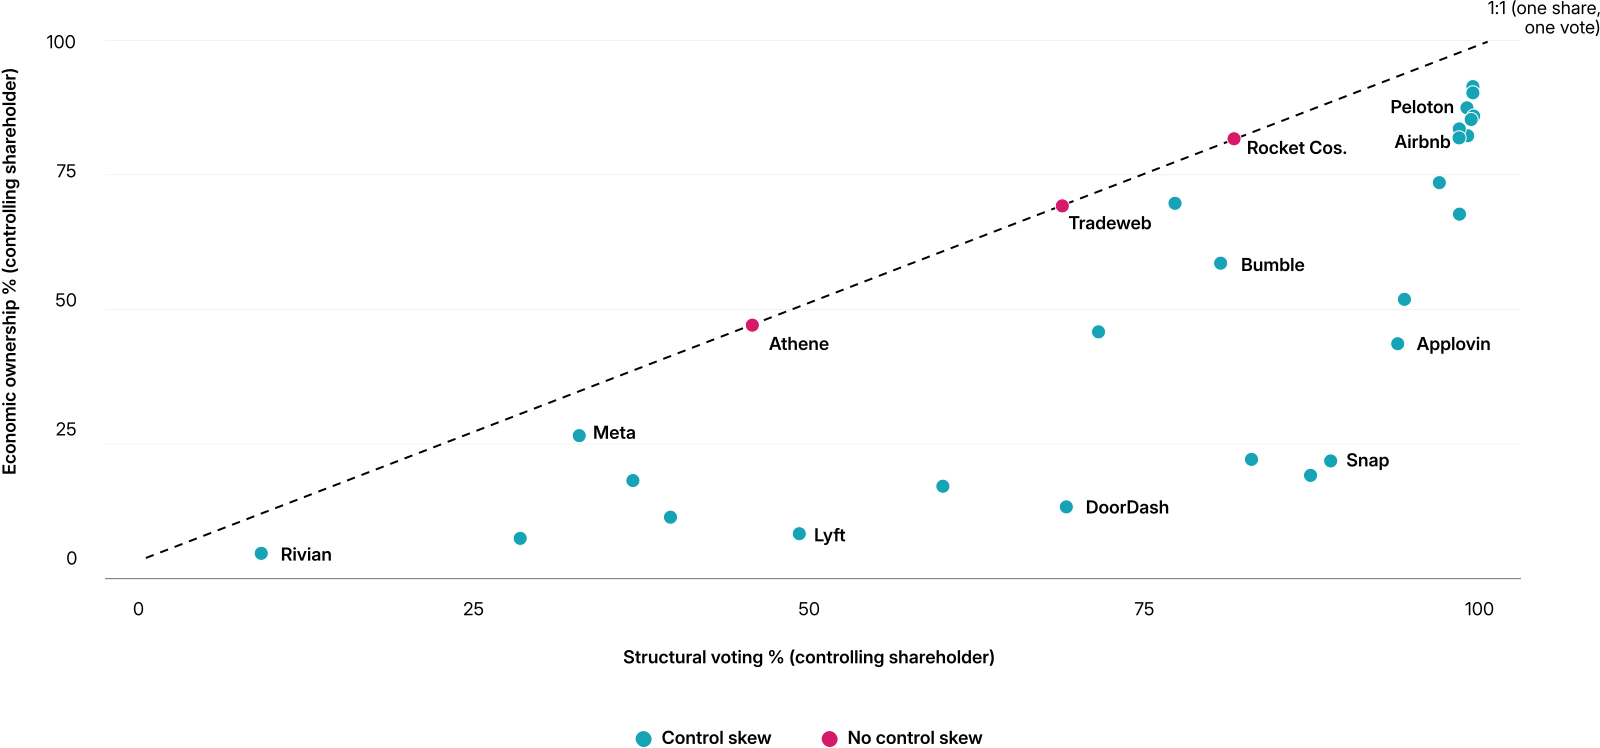
Each dot represents one multiple-class issuer at the time of IPO (n=33). The y-axis shows the controlling shareholder's economic ownership percentage; the x-axis shows their structural voting percentage. Points below the dashed 1:1 line carry more voting power than their economic stake warrants (control skew, OCA<1.0). Source: MSCI Sustainability & Climate, company SEC Form 424(b)(4), prospectus filings.
Both the multiple-class and single-class cohorts underperformed the MSCI USA Index on a total shareholder return (TSR) basis from the date of their IPO to December 2025.5 Within this shared underperformance, the gap was consistent and directional. Multiple-class companies with control skew underperformed by a median of 22.4 percentage points (pp) annually, versus 16pp for single-class peers. Only four of the 30 multiple-class companies (13%) beat the benchmark, including Meta and AppLovin Corp., compared with six of 30 single-class companies (20%). The distribution was wide in both groups, consistent with company-specific outcomes rather than a uniform effect.
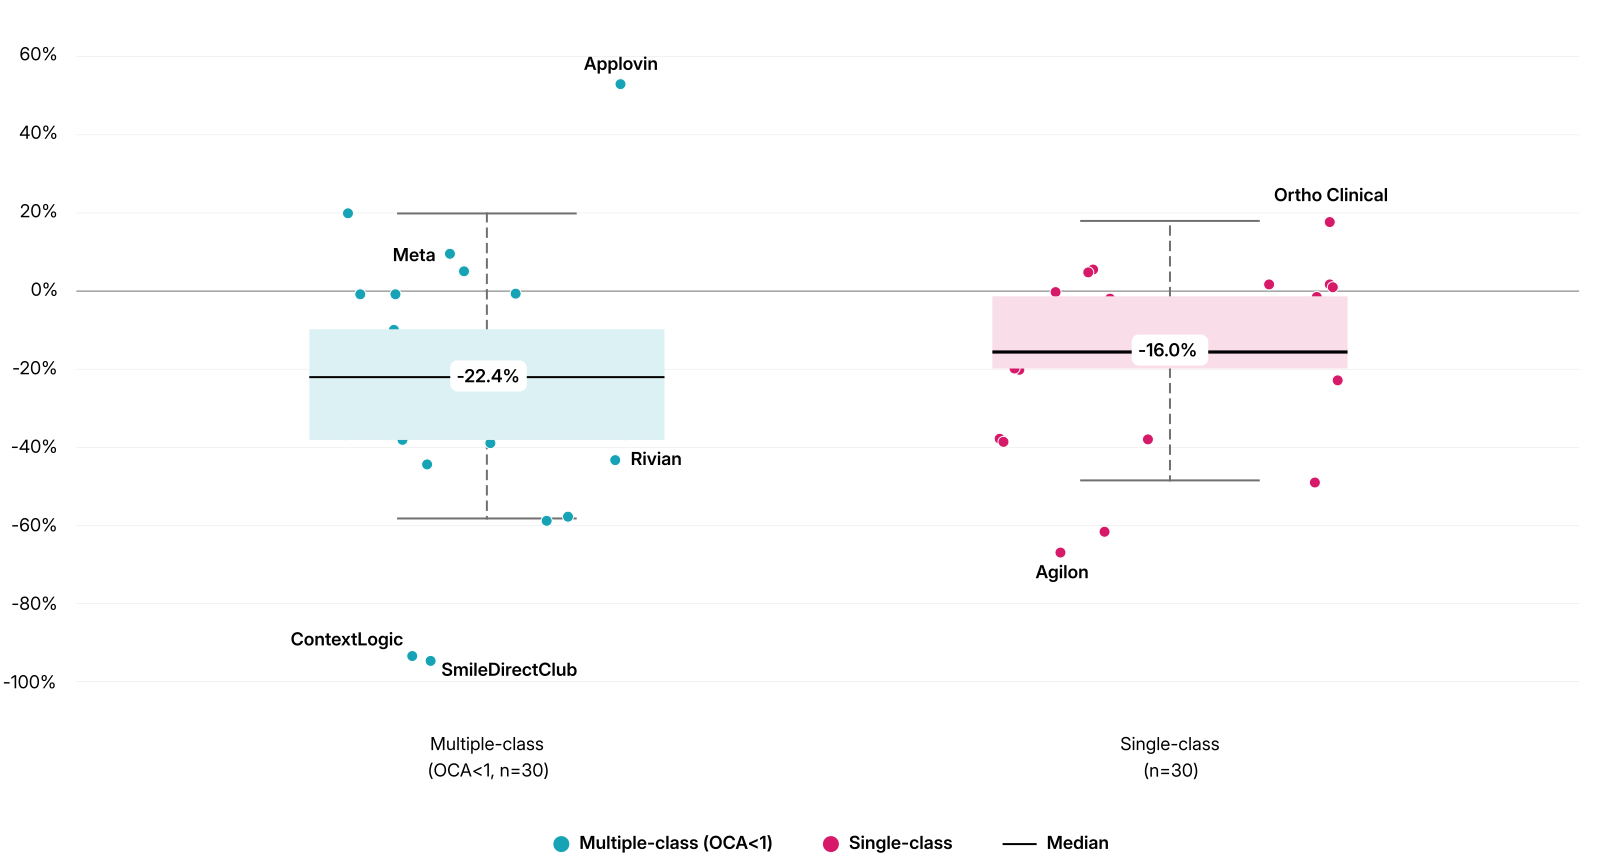
Median excess annualized TSR for each group, measured from each company's IPO date to Dec. 31, 2025. Excess annualized TSR = company annualized total return minus MSCI USA Index annualized TSR over the same calendar window, ensuring each company is benchmarked over an identical period. Non-surviving companies (acquisitions, delistings, bankruptcies) are included with returns capped at the terminal event date. Multiple-class OCA<1.0 n=30; single-class n=30. Performance analysis excludes the three multiple-class issuers with an OCA≥1.0, as their voting and economic rights are approximately aligned and they cannot be meaningfully assigned to either the multiple-class or single-class cohort. Source: MSCI Sustainability & Climate, FactSet.
The clearer distinction between the two groups appeared in the severity of losses rather than in average returns. Among companies that lost more than 50% of value peak-to-trough, the two groups were broadly similar, both exposed to the same market dislocations.
Among companies that fell more than 70%, the picture changes. Of multiple-class OCA<1.0 companies with available price data, 79% suffered a peak-to-trough drawdown exceeding 70%, compared to 50% of single-class peers. The severity gap is equally stark: Median maximum drawdown reached -87.9% for the multiple-class group, against -71.9% for single-class companies, a 16pp gap at the severe end of the distribution.
Sector concentration is a natural first explanation to test. The multiple-class cohort skews more heavily toward the information technology and consumer discretionary sectors than the single-class cohort does. However, when comparing each company’s return against its own sector, rather than the broad market, the gap widens. Multiple-class companies underperformed their own sector peers by a median of 23.7pp annually, against 8.4pp for single-class companies.
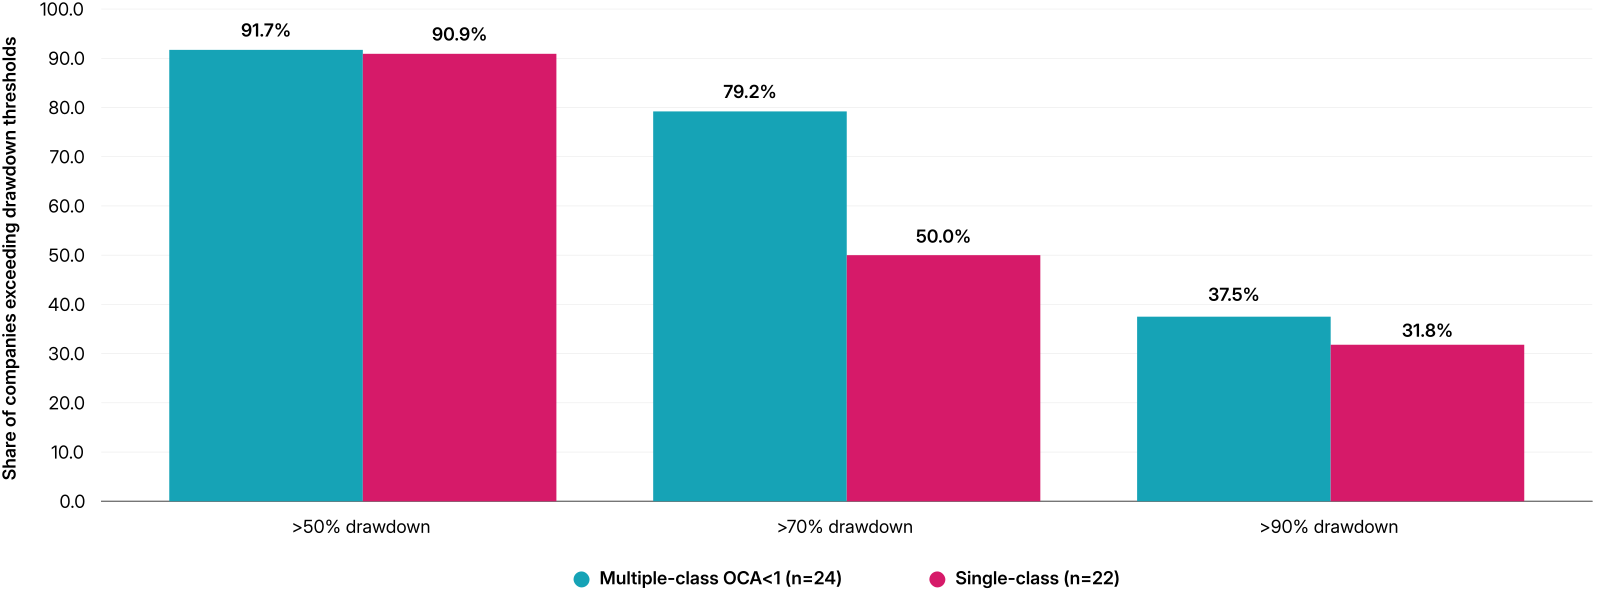
Company peak-to-trough maximum drawdown computed on daily adjusted closing prices from IPO date to Dec. 31, 2025, or terminal event date for non-survivors. MSCI USA Index drawdown computed on month-end levels; as a result, the index drawdown figure is understated relative to company figures, making the reported gap conservative. Multiple-class OCA<1.0 n=24; single-class n=22, reflecting companies with complete price data publicly traded at the measurement date. Source: MSCI Sustainability & Climate; FactSet.
When splitting the sample by IPO vintage, the gap persists in both the earlier and later cohorts, widening to 14.1pp among companies that listed before 2020, on a vintage-controlled basis. Multiple-class companies also came to market with a thinner free float, offering a median of 11.7% of shares outstanding versus 22.2% for single-class peers. Within the multiple-class group, the companies with the thinnest floats also saw the deepest drawdowns.
Market conditions at listing were nearly identical across both groups, with a trailing-12-month market return of 19.4% into multiple-class listings versus 20.1% into single-class. Multiple-class companies had a larger first-day pop on average, at a median 13% versus 8.3%, but pop size showed no relationship to subsequent performance within either group. Valuation multiples also did not predict which multiple-class companies underperformed the most. Multiple-class companies carried richer multiples at listing, but among this group, a higher multiple showed little relationship to subsequent returns. Among single-class companies, by contrast, a higher multiple was a much stronger predictor of worse performance.
As more founder-controlled companies — such as Anthropic — move toward IPO, share structure can be considered a quantifiable input to IPO due diligence. An OCA below 1.0 has been associated with meaningfully worse outcomes for shareholders in this sample. Share structure warrants consideration alongside more familiar risk variables like valuation and sector.
The relevant question is not whether to exclude IPOs with multiple-class structures categorically, but whether this risk is reflected in valuation and portfolio construction, and whether control skew is permanent or limited in time. The historical record shows a consistent, measurable pattern — reason enough to treat it as a genuine input to the investment decision, even short of a definitive causal verdict.

Subscribe todayto have insights delivered to your inbox.
How Ownership Can Shape Outcomes
Who owns a company can define its success. Discover how trends in ownership concentration impact shareholder value and why investors should factor ownership into long-term equity analysis.
ESG Ratings
Measure a company’s resilience to financially relevant, industry-specific sustainability risks.
Private Company Insights: Anthropic
Anthropic filed for its IPO in June, heralding another venture-backed megacap listing in the U.S. This report examines the company’s trading activity on secondary markets ahead of its public debut.
1 Control skew is defined as any misalignment between a controlling person, or voting bloc’s, economic exposure and voting power at a company.
2 MSCI’s three-dimensional ownership framework classifies companies into three categories under the “level of control” dimension, based on the largest owner’s voting power: (i) controlled: largest shareholder, or group, holds 30% or more; (ii) principal: largest shareholder, or group, holds between 10% and 30% and (iii) widely held: no shareholder, or group, holds more than 10%.
3 The term “controlling shareholder” refers to the individual, entity or shareholder bloc holding Class B or equivalent high-vote shares at the time of IPO. In many cases this is the company founder or founding team. In others it is a private equity sponsor (e.g. First Data Corp., Chewy Inc.), a corporate parent (e.g. Zoetis Inc., Warner Music Group Corp.) or a broad pre-IPO investor class (e.g. Airbnb, Snowflake). In all cases, OCA is calculated using the aggregate economic and voting percentages attributable to the Class B share class.
4 Three multiple-class companies in the cohort had an OCA at or above 1.0 at listing, meaning the controlling shareholder's economic stake equaled or exceeded their structural voting percentage (the inverse of control skew). All three reflect atypical capital structures: a hard voting cap (Rocket Cos.), a multi-class Up-C arrangement with non-economic voting shares (Tradeweb) and a fixed aggregate voting percentage structure (Athene). In a conventional dual-class design, OCA is bounded below 1.0 by construction. These three are structural exceptions rather than genuine cases of no control skew and are excluded from the performance comparison on that basis. Had they been included in the no-control-skew group, the median excess annualized TSR gap between the two groups would have widened from 6.4pp to 7.1pp.
5 TSR is measured from first-day closing price to Dec. 31, 2025 (dividend-adjusted). First-day close is used rather than offer price, as it reflects the entry point available to the broad market.
The content of this page is for informational purposes only and is intended for institutional professionals with the analytical resources and tools necessary to interpret any performance information. Nothing herein is intended to recommend any product, tool or service. For all references to laws, rules or regulations, please note that the information is provided “as is” and does not constitute legal advice or any binding interpretation. Any approach to comply with regulatory or policy initiatives should be discussed with your own legal counsel and/or the relevant competent authority, as needed.