
The Price of Property-Market Liquidity
- Investors are demanding a far steeper liquidity premium in office markets vs. industrial, with pricing pressure deepening in gateway office markets like Central London.
- MSCI Capital Liquidity Scores show that liquidity, not just price, is diverging both within and between sectors, and the importance of liquidity as key to analyzing pricing changes through the cycle.
- Real-estate investors' understanding of relative market liquidity and the interplay between liquidity and pricing will become increasingly important as property navigates a more uncertain environment.
Liquidity carries a price in real estate, but that price is not the same across property sectors. At MSCI, our analysis suggests that investors demand substantially more compensation for taking liquidity risk in office markets than they do in industrial.
The analysis also demonstrates that investors place a premium on assets in more liquid markets, with a sustained relationship between liquidity and pricing through the history of the dataset.
Of course, property is inherently illiquid, and liquidity is not the only factor that influences market pricing — growth expectations and external benchmarks like government-bond yields play an important role. But liquidity can be shown to have a key influence on how real-estate markets and sectors are priced relative to one another, and both liquidity and volatility vary markedly among top property markets according to MSCI Capital Liquidity Scores, which recently expanded to include new markets and sectors.
The spread in transaction yields between the most- and least-liquid office markets is substantially greater than the equivalent spread in industrial, as of Q2 2026. In other words, investors require greater compensation to move into less-liquid office markets, while industrial buyers appear more willing to accept liquidity risk without the same pricing discount.
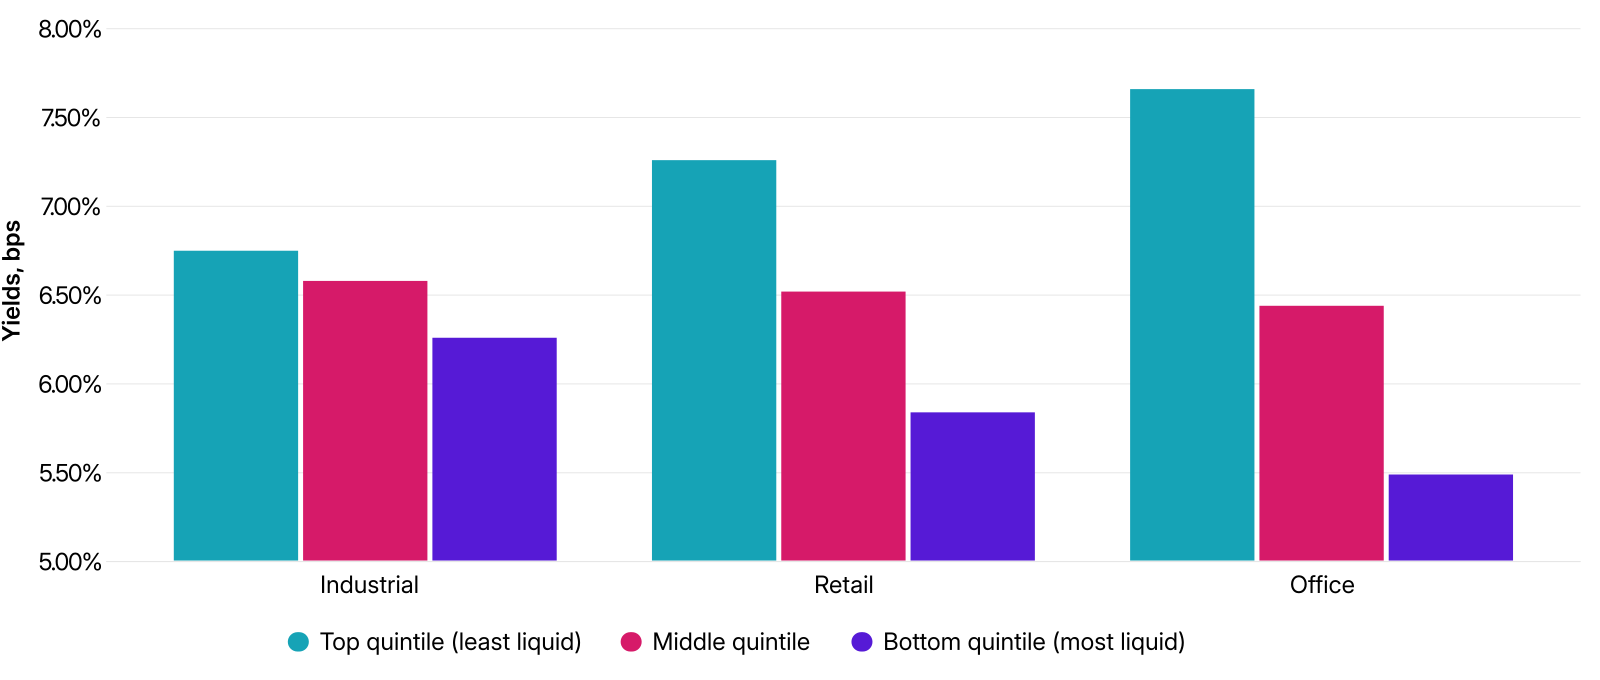
Data as of Q2 2026.
The narrower spread in industrial may tell us something fundamental about the differences between office and industrial property. Warehouses are relatively homogeneous compared with offices, where differences in building quality, micro-location, specification and occupier demand can have a much greater bearing on performance.
Investors may therefore require less additional compensation to move from a highly liquid industrial market into a less-liquid one. This distinction has arguably become more important as offices undergo a structural shift: Occupier demand has refocused on the best-quality assets in the best locations, increasing the potential penalty attached to assets where either location or quality falls short.
Industrial looks different. Institutional capital has made a sustained move into the sector and transaction volumes remain relatively elevated compared with recent history. With more capital competing for assets, investors may also be willing to accept less compensation for moving into less-liquid markets than they would in a sector where capital is scarcer.
The contrast is visible in the world's most-liquid markets. For industrial, Outer London, Sydney, Atlanta, Dallas and LA's Inland Empire currently rank highest, and all have liquidity scores above their long-term averages. The leading office markets tell almost the opposite story. Manhattan, Tokyo's five central wards, Sydney, Seoul and Central London are the world's most-liquid office markets, but all except Seoul currently have liquidity scores below their long-term averages.
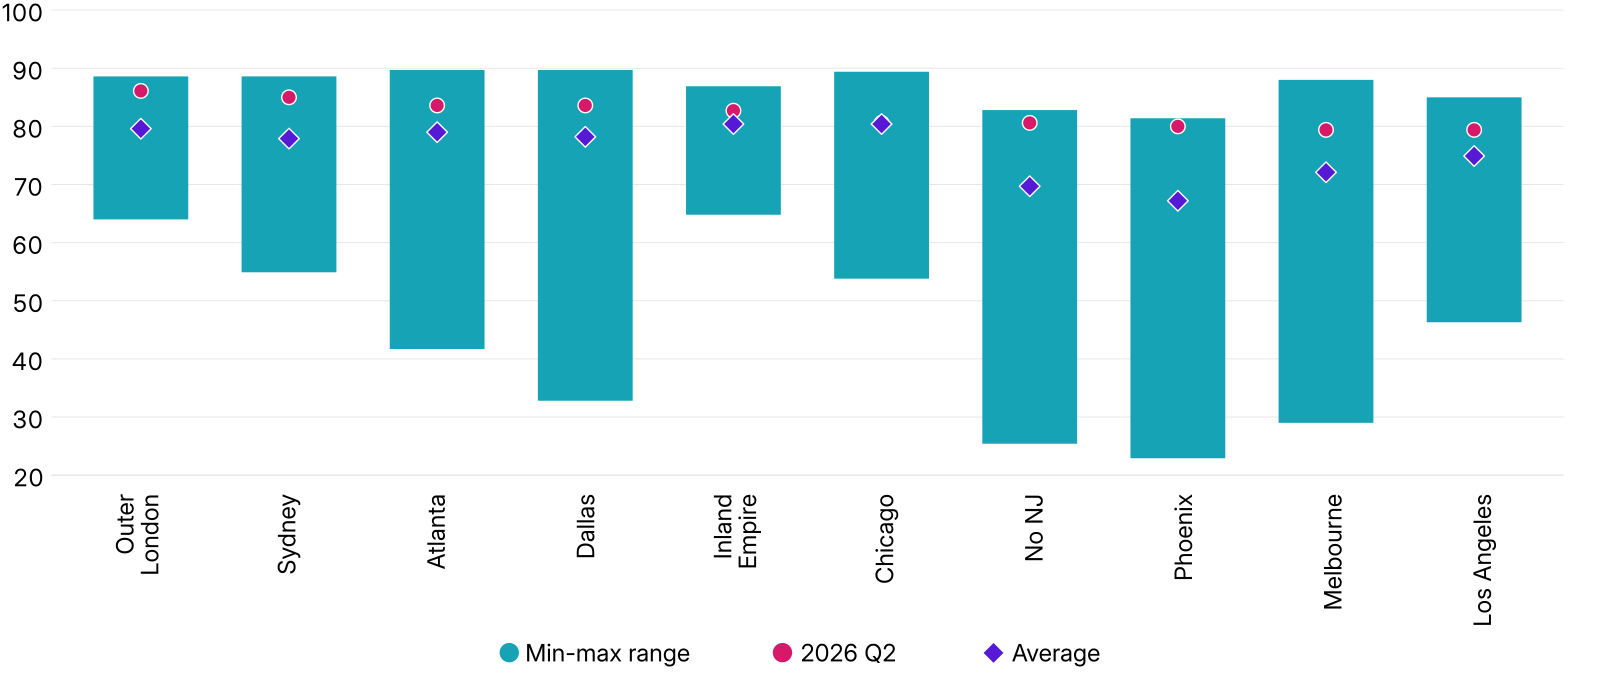
Data as of Q2 2026.
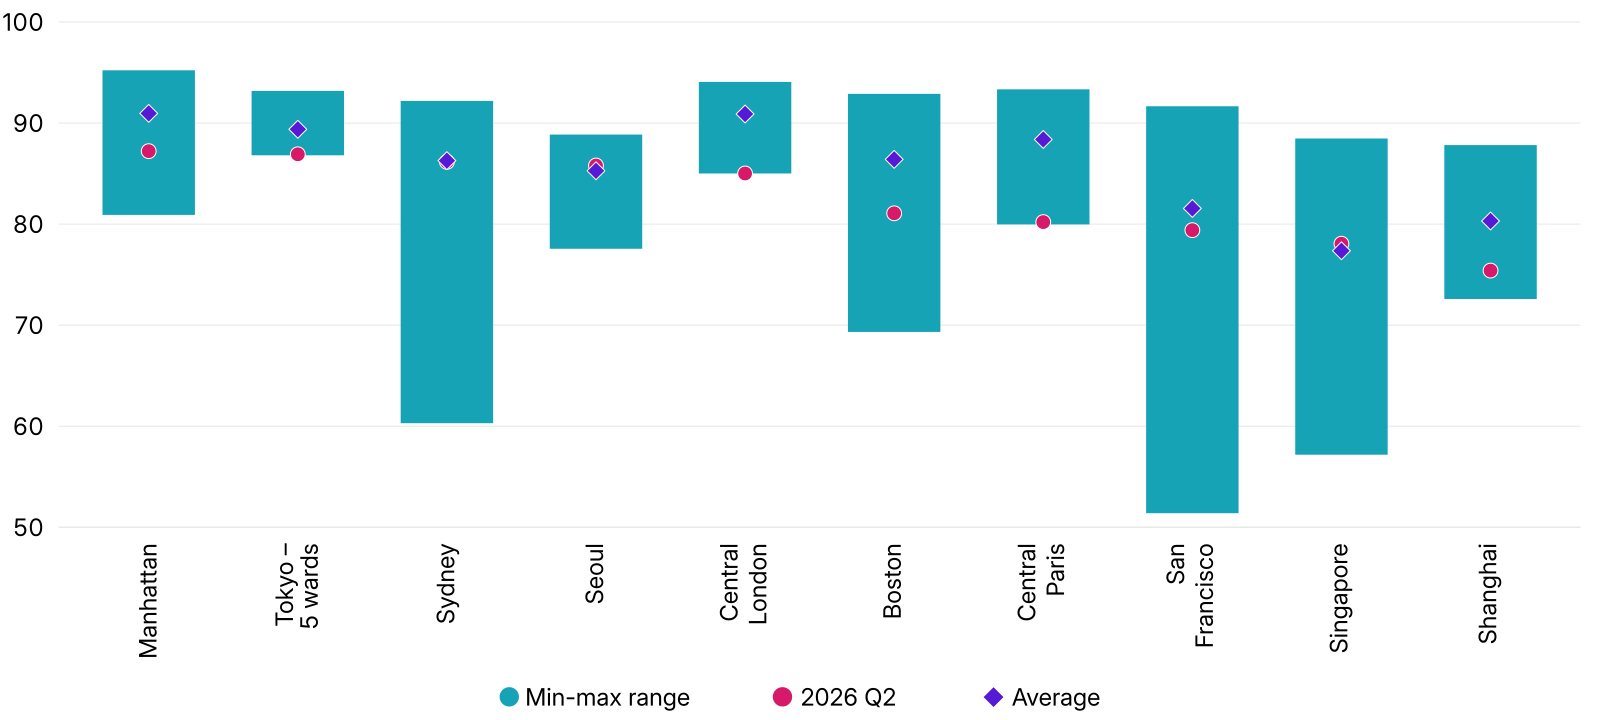
Data as of Q2 2026.
The comparison matters because liquidity relative to recent history can provide investors with another signal about where pricing may be heading. Markets running substantially above their trailing liquidity averages have historically experienced stronger competitive pressure, while those below trend have faced downward pressure on pricing.
The current MSCI data shows that not only is Central London office liquidity below its five-year trailing average, it is also at the lowest level ever recorded. Lower liquidity in Central London is reflected in pricing data, with average transaction yields moving out by around 60 basis points (bps) over the last 12 months.
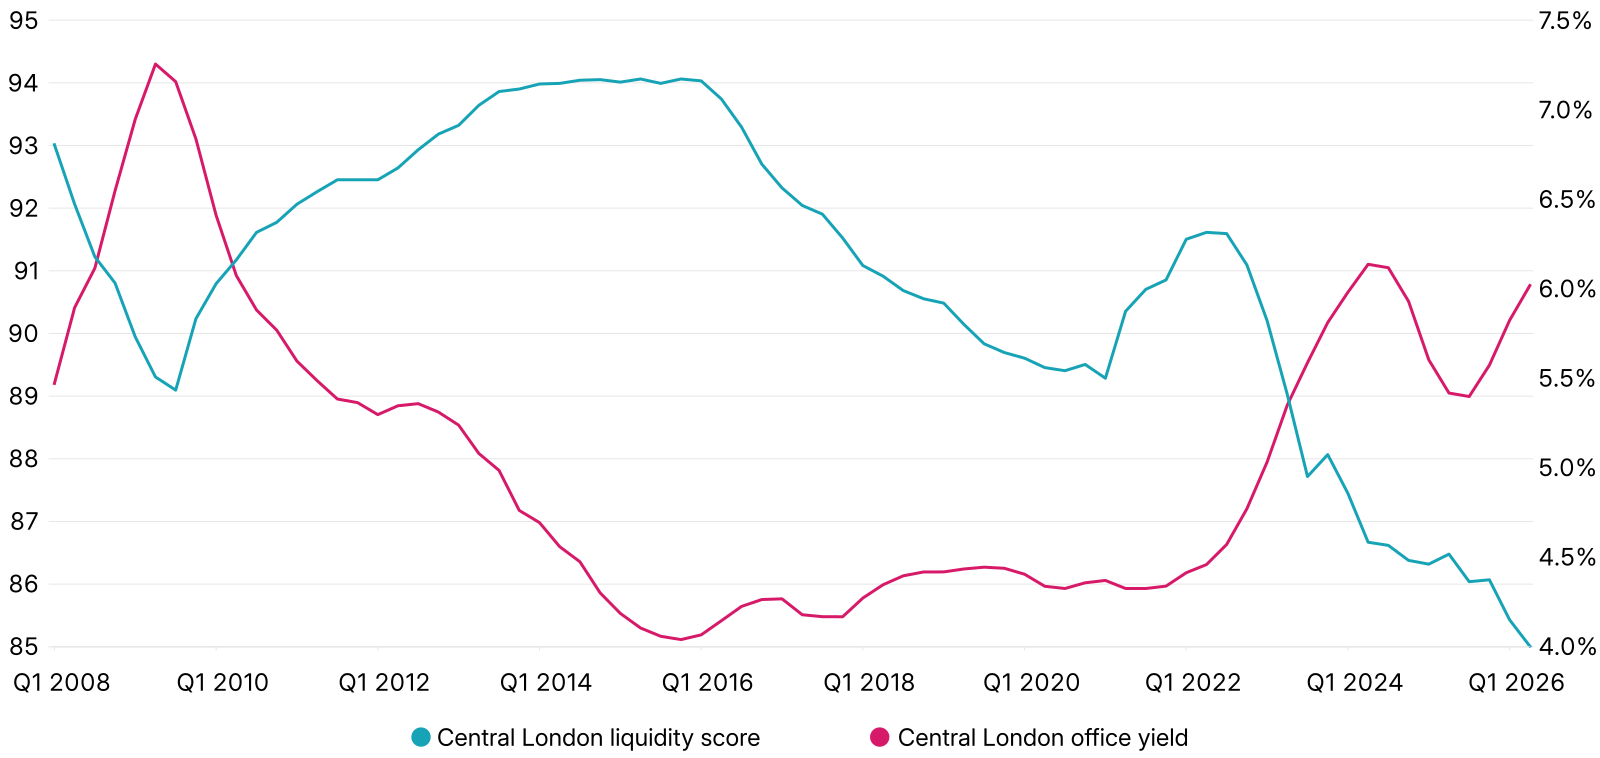
In contrast, office market liquidity in Q2 in Seoul was above its recent average and office yields compressed by around 30 bps in the 12 months through June 2026. However, the recent spike in government-bond yields means there is now a negative yield gap between Seoul offices and government bonds, a situation that has historically presaged a correction. This also illustrates the risk that markets where liquidity is running hot may be in danger of overreaching themselves and vulnerable to a correction if conditions change.
The importance of liquidity as a predictor of pricing has also changed through the cycle. More recently, the link between the two measures has strengthened, suggesting that a greater premium is being placed on property in more-liquid markets as the sector continues to navigate a recovery characterized by a less abundant pool of capital than in the last cycle.
Without the tailwind of steadily falling interest rates, asset and market selection have become more important determinants of performance. Entry pricing matters correspondingly more. Understanding not just how liquid a market is, but whether that liquidity is strengthening or weakening, can provide investors with an important additional input.

Subscribe todayto have insights delivered to your inbox.
Real Capital Analytics
Transparent, proprietary intelligence across global private real estate markets connecting investors, funds, assets and transactions on one platform.
Did Market Liquidity Impact Real Estate Returns?
Real estate is an illiquid asset class. But liquidity can also vary considerably between different assets, markets and time periods. Have differences in liquidity within real estate had an impact on investment returns?
A Liquid Benchmark for Private Real Estate
Commercial real estate represents an important element of the asset allocation process but is difficult to access directly, with high barriers to entry and exit.
The content of this page is for informational purposes only and is intended for institutional professionals with the analytical resources and tools necessary to interpret any performance information. Nothing herein is intended to recommend any product, tool or service. For all references to laws, rules or regulations, please note that the information is provided “as is” and does not constitute legal advice or any binding interpretation. Any approach to comply with regulatory or policy initiatives should be discussed with your own legal counsel and/or the relevant competent authority, as needed.