
The Rise of Continuation Funds
- Continuation funds have become a mainstream exit route, raising over USD 210 billion. The MSCI Global Private Equity Single-Asset and Multi-Asset Continuation Fund Indexes show marks stayed positive through the 2022-23 downturn.
- Multi-asset funds have created more value and returned cash sooner than single-asset funds, which four years in still hold about three-quarters of their value as unrealized marks.
- For investors weighing a roll, most continuation funds are a concentrated bet on a few mature companies, often just one. Whether their marks prove conservative or generous is a question only exits will answer.
Mentioned in this blog post:
In a private-equity (PE) market short on exits, a continuation fund1 (CF) offers something new: a way for limited partners (LPs) to cash out while general partners (GPs) keep their best assets.2
A CF is a new fund raised to roll over one or more assets out of an existing fund so that the existing fund LPs have a liquidity event and the fund can be wound down. Existing LPs choose whether to cash out or roll their stake into the new fund — often a concentrated bet on a single company, usually against a short election deadline. New investors, often firms specializing in underwriting secondary transactions, supply the capital to buy out those who sell. The GP sits on both sides of the deal, selling from one fund and buying for another, so the transaction price, and the marks that follow, draw close scrutiny. The GP continues managing assets it knows well, and — generally — both the fund lifetime clock and the fee economics reset. Unlike a traditional drawdown fund, though, a CF is designed to be short-lived: The funds in our dataset that have already been wound up did so in a median of about five years, significantly shorter than the decade-plus life of a conventional fund.
When it goes well, all parties can benefit from the transaction. With initial public offerings (IPOs) scarce and exit markets strained, CFs give LPs a liquidity option while letting GPs hold "crown-jewel" companies for potential further upside. Using the MSCI Global Private Equity Single-Asset and Multi-Asset Continuation Fund Indexes, built from fund-level cash flows and valuations, we look at how large the market has become, what CFs are holding and whether the performance — and distributions — justify the scrutiny placed on these transactions.
There are only a handful of CFs in our dataset before 2018, but the practice has exploded in popularity since 2020, with 2025 seeing the launch of 77 funds. So far, CFs are overwhelmingly a PE story with roughly 86% of capital in PE-focused funds, with 60% of the total being allocated toward buyout-oriented deals. The mix of single-asset versus multi-asset funds has drifted over time with multi-asset CFs in vintages through 2020 representing about three-quarters of capital raised. In 2025, however, the annual commitments are led by the single-asset funds, which have raised twice the capital of their multi-asset counterparts. With this shift, CFs have evolved from a way to wind down end-of-life portfolios into what GPs increasingly present as a new tool to extend ownership and create additional value in their most prized assets.
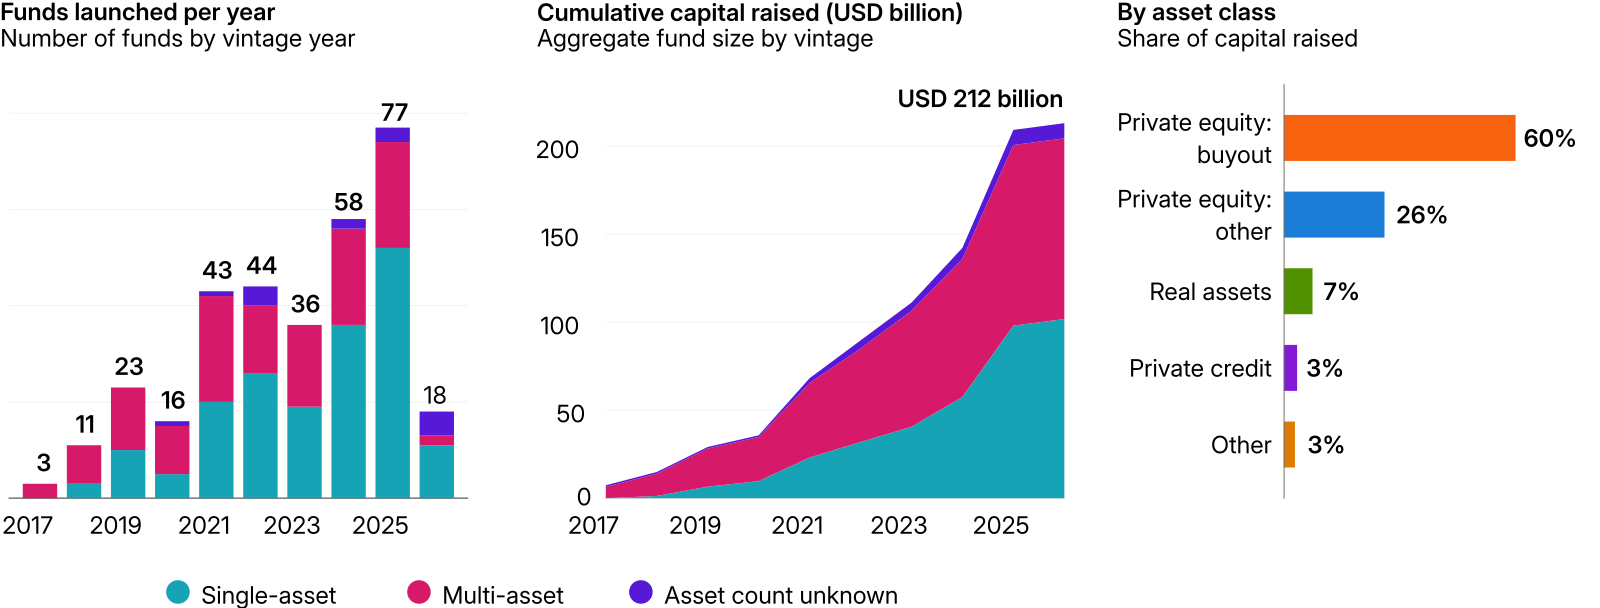
MSCI Global Private Equity Single-Asset and Multi-Asset Continuation Fund Indexes. Launches and cumulative capital split by asset count. Asset class by share of fund size (USD). Data from Jan. 1, 2017, through June 30, 2026.
Measured by cumulative net cash flow (distributions less capital contributed, as a share of fund size), continuation funds skip the downward part of the J-curve. Because they buy their assets on day one, the median fund sits at about -85% in its first quarter, with part of the committed capital held back for follow-on investments and expenses. On the other hand, a traditional PE drawdown fund starts near -10% and takes about four years to reach its cumulative low point of net cash flows of around -65%.
From this starting point, the asset count drives how these funds behave. Multi-asset funds can sell some holdings early and return cash, so by year five the median has recovered to about -30%. For single-asset funds, distributions typically depend on a single exit event, so results can vary widely: The top quartile is already cash-flow positive but the bottom-quartile fund is still near -95%. The median drawdown fund, by comparison, turns cash-flow positive only around year nine.
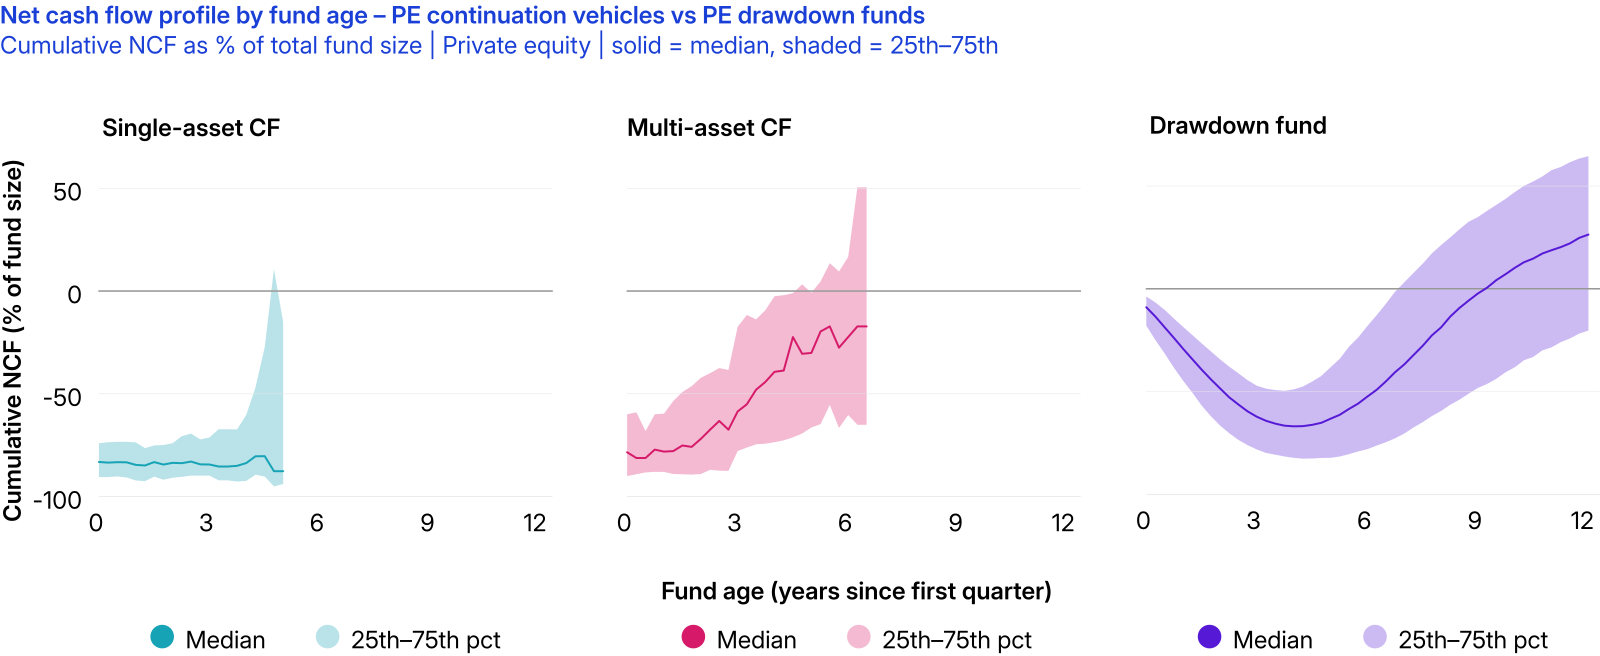
Illustrative. Cumulative net cash flow as a percentage of fund size by fund age, Jan. 1, 2017, through June 30, 2026; PE CFs by asset count vs. PE drawdown funds; solid line = median, shaded band = 25th to 75th percentile.
The MSCI Global Private Equity Single-Asset and Multi-Asset Continuation Fund Indexes show that CFs' returns have generally followed the recent PE cycle, but their reported returns held up better in the downturn. Rolling one-year returns peaked in 2021, at about 65% for single-asset funds and just over 50% for multi-asset funds. In 2023, when the MSCI Global Private Equity Closed-End Index briefly turned negative, both CF indexes stayed positive and multi-asset funds recovered faster through 2023 and 2024. Since then, single-asset funds have pulled ahead. That resilience reflects reported valuations, though, and only exit prices will show whether it holds.
MSCI Global Private Equity Single-Asset and Multi-Asset Continuation Fund Indexes (Unfrozen; USD) vs. MSCI Global Private Equity Closed-End Index; trailing four-quarter time-weighted return. September 2020 through June 2026.
Compared at the same age, continuation funds start further along the value-creation curve than drawdown funds: The GP already knows the companies, and the transfer price gives the marks a recent, negotiated starting point. From there, they diverge by asset count. Single-asset funds stall at about 1.3x total value to paid-in (TVPI), and drawdown funds of similar vintages have caught up by year four. Multi-asset funds keep building, to about 1.6x, and by year four have returned roughly 40% of capital, against 25% for single-asset funds and about 13% for drawdown funds. Earlier MSCI research found that buyout GPs tend to value companies conservatively before a sale, but that the cushion thins for older holdings.3 Continuation funds' assets sit awkwardly in that picture: The companies are old, but their marks were just reset by a transaction. Only exits will settle which effect wins.
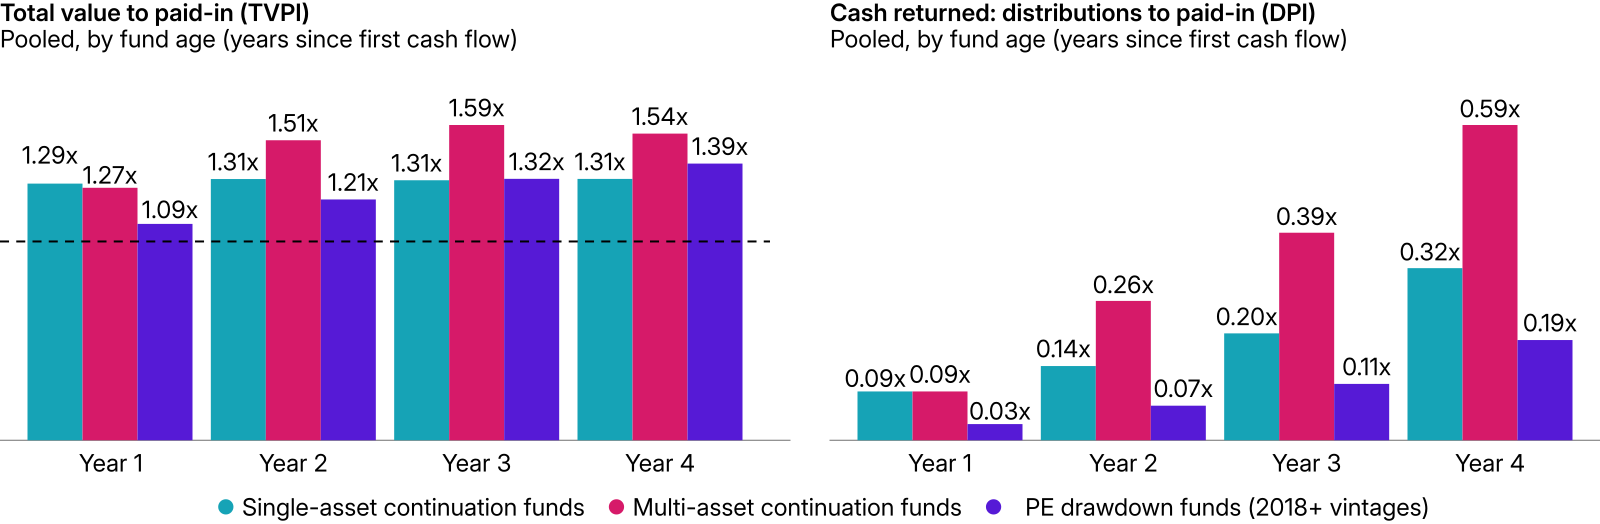
Pooled total value to paid-in (TVPI) and distributions to paid-in (DPI) at each fund age (years since first cash flow). Vintages 2018 and later with results through June 2026.
Have continuation funds met expectations? On the marks, yes: Index returns held up better than traditional drawdown funds, and multi-asset CFs have backed their valuations with at least some cash distributions. The single-asset story, however, is still largely a paper one, a concentrated bet on one company, with the final chapter waiting on a future exit. That is where like-for-like benchmarks earn their keep. Setting a CF's distributions and interim marks against its CF peers, rather than against drawdown funds on a very different clock, helps market participants judge the question that matters most: Was the GP rolling a trophy asset with room to run, or one it could not sell?
Continuation funds have given PE a way to deliver liquidity in a market short on exits, but they blur two lines that are normally clear: between buyer and seller, and between exiting an asset and simply holding it longer. With the GP on both sides of the trade, the agency problem is built in, and existing LPs must decide whether to cash out or roll into a new vehicle run by the same manager. For now, most of the value still rests on the GP's judgment about companies it chose not to sell. How that judgment holds up will decide what CFs become: a lasting way to back good businesses for longer, or an elaborate way to put off hard questions.


Subscribe todayto have insights delivered to your inbox.
Private Equity Indexes
MSCI Private Equity Indexes provide detailed benchmarks for private equity performance, spanning various strategies and regions.
When Buyout Marks Meet the Market
In buyout, managers tend to mark investments conservatively, but for aging assets and weaker performers, the variation in valuations changes — with important implications for asset owners.
Preserving the Past: The Case for Frozen Indexes in Private Assets
Investors in private markets must choose between frozen (fixed) and unfrozen (evolving) private-capital indexes, balancing accuracy, timeliness and purpose for best results.
1 Continuation funds are also referred to as both continuation vehicles (often abbreviated "CVs") and, more generically, secondary funds.
2 This same pressure is one of the forces driving the rise of semi-liquid funds.
3 Across global buyout exits from 2012 to 2025, 82% cleared above the GP's valuation one quarter before exit, falling to 68% for holdings of 10 years or longer.
The content of this page is for informational purposes only and is intended for institutional professionals with the analytical resources and tools necessary to interpret any performance information. Nothing herein is intended to recommend any product, tool or service. For all references to laws, rules or regulations, please note that the information is provided “as is” and does not constitute legal advice or any binding interpretation. Any approach to comply with regulatory or policy initiatives should be discussed with your own legal counsel and/or the relevant competent authority, as needed.