The Truth Will Out: Is Private Equity Overvalued?
Key findings
- Burgiss data and novel analytics suggest that, in the aggregate, U.S. venture-capital funds were overvalued as of Q1 2022, but U.S. buyout funds were not.
- The new methodology produces an index of over- or undervaluation based exclusively on the Burgiss Manager Universe (BMU) and is independent of the behavior of other macro variables such as listed equities.
- Possible overvaluations may make current allocations to private equity seem larger than they truly are, an impression referred to as the denominator effect.
This blog post originally appeared on Burgiss.com. MSCI acquired The Burgiss Group, LLC in October 2023.
Given the significant recent market moves there has been much debate regarding whether the valuations of private-equity funds are too high. Part of the concern stems from the two types of lags present in private-capital data. First, there is a reporting lag of about three months. Second, reported valuations are subjective, often incorporating lagged sources of data such as comparable transactions, which leads to even further lagging of valuations. After large market moves, this lag causes investors to be unsure of their exposure to private capital, their allocations relative to their targets and what their expectation of near-term returns should be.
Cumulative returns of venture-capital and buyout funds
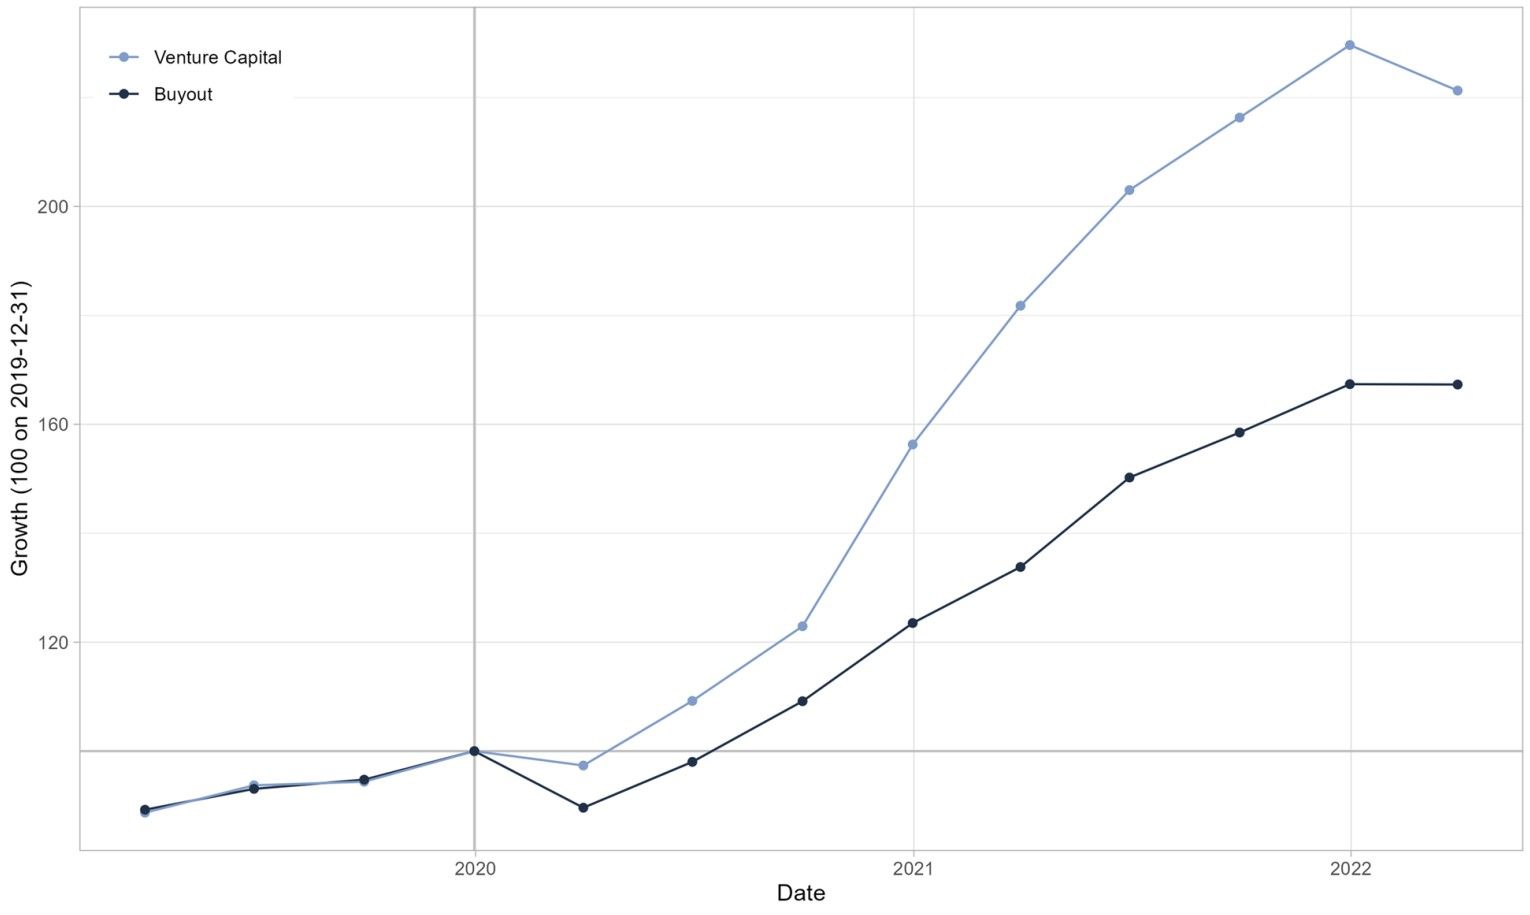
Data as of March 31, 2022.
An understanding of the lagging and smoothing of private-capital data relative to a listed index, together with the recent returns of the listed index, provides guidance on whether valuations are currently too high or too low. There is a second approach, however, that relies purely on private-capital data. The core idea is to exploit the fact that fund valuations are subjective and may suffer from biases, but that fund cash flows are objective, that is, distributions reveal the true value of assets, and the truth will out.
Uncovering the truth in valuations
The intuition of how the cross-sectional variation in fund cash flows allows one to infer the degree of over- or undervaluation of fund assets is simple. Suppose we can observe two funds during some quarter, and both have the same return (which we consider to be typical for the asset class). Let's assume, further, that one fund does not exit from any of its investments (and, hence, distributes nothing to its investors), while the other exits from some of its investments (and, hence, makes a distribution to its investors).
If all valuations were fair, then the reported returns of the two funds would be equal, but if the assets of the second fund were overvalued, this would depress its reported return. More generally, if assets are overvalued, funds with higher distributions will tend to have slightly lower returns; conversely, if assets are undervalued, funds with higher distributions will tend to have slightly higher returns.
The previous paragraph implicitly defines what we mean by over- or undervaluation, but it bears repeating: we say that a fund is overvalued if the value of its assets exceeds what they could be sold for.
In other words, we focus on the valuation of the assets relative to the fair market value (FMV). Note that sometimes these assets may be sold into the public markets (in the case of an IPO), but sometimes they may be sold to other private equity funds or other investors. Our methodology does not distinguish between these different exit types[1] and is silent on whether the FMVs are themselves too high or too low.
The methodology briefly described above relies on a universe of private-capital funds.[2] We use the fund-level BMU.[3] Estimating a time-varying valuation bias is difficult and involves some amount of smoothing, which we carry out using spline regressions. Finally, note that the methodology extrapolates from the limited distributions of funds in order to infer a bias across the entire valuation of the fund; on account of this, we feel the index is directionally correct, but its absolute level should be taken with a pinch of salt.
In the following exhibit, we see the result of applying this methodology to U.S. buyout and venture-capital funds.
Overvaluation index for US venture-capital and buyout funds
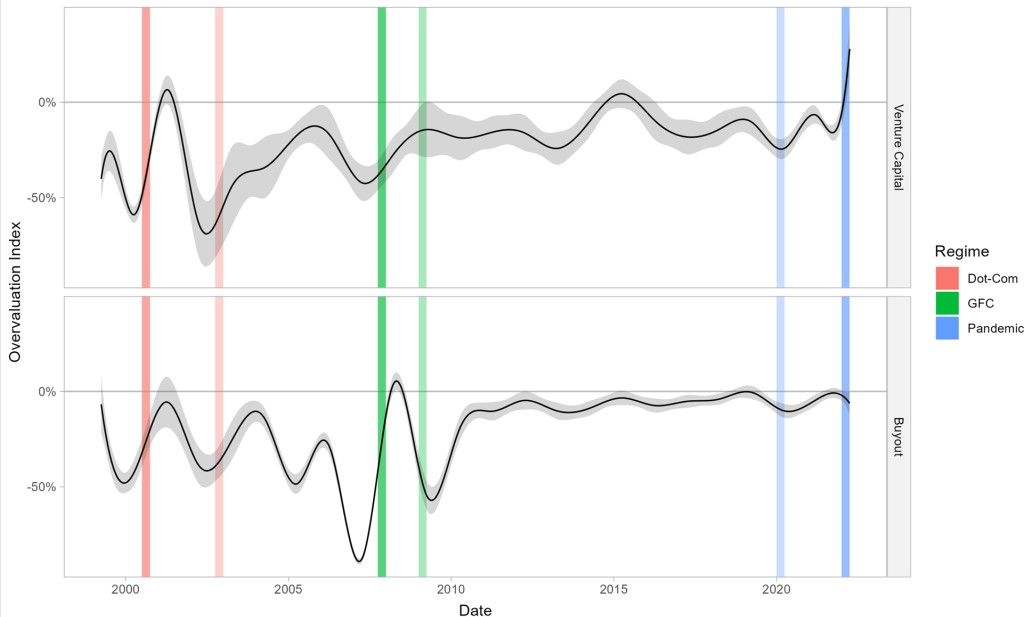
Data as of March 31, 2022. The black line is an indication of whether fund assets are over- or undervalued relative to their fair market values. The colored bars correspond to various regimes; the darker color indicates the quarters when the U.S. public-equity markets achieved their maximum values, and the lighter color when they achieved their minimum values.
The black line displays the valuation bias, where a positive value suggests that assets of the fund are overvalued. The colored vertical bars represent when public equity markets achieved their maximum and minimum values during various regimes. On average, funds tend to have a bias in the direction of somewhat undervaluing their assets. However, during significant market moves this bias swings wildly: as of Q1 2022, the index suggests that venture-capital funds are overvalued relative to their FMVs, but buyout funds are only slightly undervalued, which is in line with recent history.
Also noteworthy is how this index has behaved during various historical regimes:
- Dot-com boom and bust (red): Venture capital became overvalued shortly after the public markets peaked. The response of buyout funds was, as expected, much more muted.
- Global financial crisis (green): The index behaved in a complementary way to the behavior observed during the dot-com boom and bust, with buyout funds becoming slightly overvalued, but venture-capital funds being less affected.
- Start of 2015: Around this time, a correction in technology stocks was reflected in the valuation bias, with a noticeable overvaluation in venture capital along with a much smaller effect among buyout funds.
- Current period (Q1 2022): Buyout funds have recently been less undervalued than was typical in the past but seem to be returning to historical levels, whereas venture capital is showing clear signs of being overvalued.

Subscribe todayto have insights delivered to your inbox.
1 The BMU dataset captures the exit type; thus, a topic for future research is whether a difference exists between the bias implied by these two exit types.2 The analyses in this article were carried out using data from the BMU with results through Q1 2022. We used data on over 1,400 buyout funds and 2,200 venture-capital funds. These funds generated over 500 individual-distribution cash flows per quarter at the start of our sample period, to over double that in recent quarters, thus providing our methodology with the required cross-sectional dispersion in distribution amounts.3 The BMU dataset also contains holdings- and security-level data. We may revisit the questions in this blog post using this additional data in the future.4 Arguably, it would be more accurate to call this a numerator effect.
The content of this page is for informational purposes only and is intended for institutional professionals with the analytical resources and tools necessary to interpret any performance information. Nothing herein is intended to recommend any product, tool or service. For all references to laws, rules or regulations, please note that the information is provided “as is” and does not constitute legal advice or any binding interpretation. Any approach to comply with regulatory or policy initiatives should be discussed with your own legal counsel and/or the relevant competent authority, as needed.