
What Does History Tell Us About Factor Investing in Japan?
- Over more than 25 years, the MSCI Japan High Dividend Yield and Enhanced Value Indexes delivered around 4% annualized excess returns, with Japan’s factor indexes generally taking on less additional risk than their U.S. counterparts.
- The MSCI Japan Momentum Index's annualized excess return moved from -3.3% in the 2000s to +2.6% in the 2020s, while the MSCI Japan Equal Weighted Index went from +5.6% to -3.5%.
- For asset owners and managers building Japanese equity portfolios, combining MSCI Japan Factor Indexes improved risk-adjusted outcomes, with lower-correlation combinations showing larger gains against maximum drawdown.
Mentioned in this blog post:
MSCI Japan Factor Indexes | MSCI Japan Index | MSCI USA Index
Japan's strategic-beta market remains relatively small compared with other major markets, suggesting that systematic factor-based equity strategies have yet to become widely adopted by Japanese investors.1 To assess the role these strategies could play in Japanese equity portfolios, we examined more than 25 years of MSCI Japan Factor Index history.
From Dec. 31, 1999, through July 31, 2026, the average annualized excess return across the seven MSCI Japan Factor Indexes was 1.4%, compared with 1.1% across the corresponding MSCI USA Factor Indexes, despite the MSCI Japan Momentum and Quality Indexes’ underperforming the MSCI Japan Index while none of the corresponding MSCI USA Factor Indexes underperformed the MSCI USA Index. More striking is how those excess returns were earned in Japan: Compared with the U.S., Japanese factor indexes generally achieved their excess returns with much smaller increases in risk relative to their respective parent indexes than their U.S. counterparts. High Dividend Yield, the strongest-performing factor in Japan, did so with 1.8 percentage points (pp) less annualized risk, versus 2.7 pps for Enhanced Value, the strongest-performing U.S. factor.
Momentum stands out as the clearest exception. Although the MSCI Japan Momentum Index has recovered in recent years, its long-term performance remained weaker than in the U.S. Weak momentum in Japan has long been considered a puzzle in academic literature. Possible explanations include more frequent market regime transitions2 and lower investor overconfidence,3 both of which may have reduced the persistence of the momentum effect. By contrast, the MSCI Japan Quality Index exhibited a different pattern. While it slightly underperformed the MSCI Japan Index over the full sample period, a sector-neutral version of the quality index (the MSCI Japan Sector Neutral Quality Index) generated an annualized excess return of 0.6% at 15.7% risk, 1.2 pps below the MSCI Japan Index. This suggests that sector tilts may partly explain the weaker long-term performance and the absence of risk reduction in the MSCI Japan Quality Index.
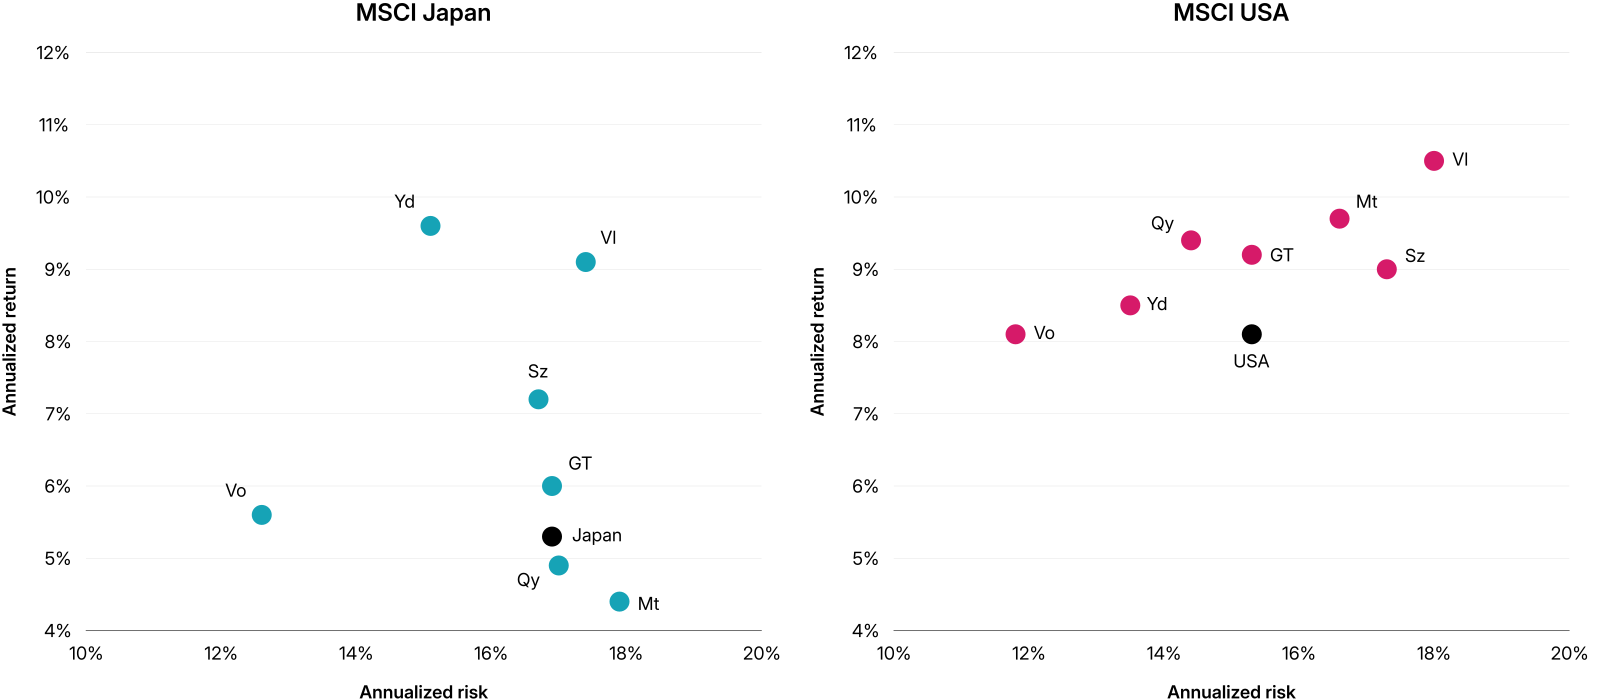
Abbreviations: Yd = High Dividend Yield; Vl = Enhanced Value; Sz = Equal Weighted; Vo = Minimum Volatility; GT = Growth Target; Qy = Quality; Mt = Momentum. Annualized gross returns and risk are calculated over the period from Dec. 31, 1999, through July 31, 2026. MSCI Japan results are denominated in JPY, while MSCI USA results are denominated in USD.
Looking beyond long-term averages reveals how factor leadership has shifted across three sub-periods, which broadly coincided with distinct macroeconomic regimes in Japan. High Dividend Yield, Enhanced Value and Equal Weighted were the factors that led during the 2000s, a decade spanning the dot-com bust and the 2008 global financial crisis, while Momentum consistently ranked among the weakest-performing factors. The 2010s, shaped by Abenomics4 and a prolonged reflationary environment, left little to choose between factors: The previous decade's leaders gave up their advantage, and the spread between best and worst narrowed from 11.6 pps to 1.6 pps. It widened again to 8.7 pps in the 2020s, a period of post-COVID-19 inflation and interest-rate normalization, with High Dividend Yield, Momentum and Enhanced Value emerging as the strongest-performing factors, while Minimum Volatility and Equal Weighted lagged. Momentum recorded the largest improvement in annualized excess return across the three sub-periods, while Equal Weighted recorded the largest decline, by 5.9 pps and 9.1 pps, respectively.
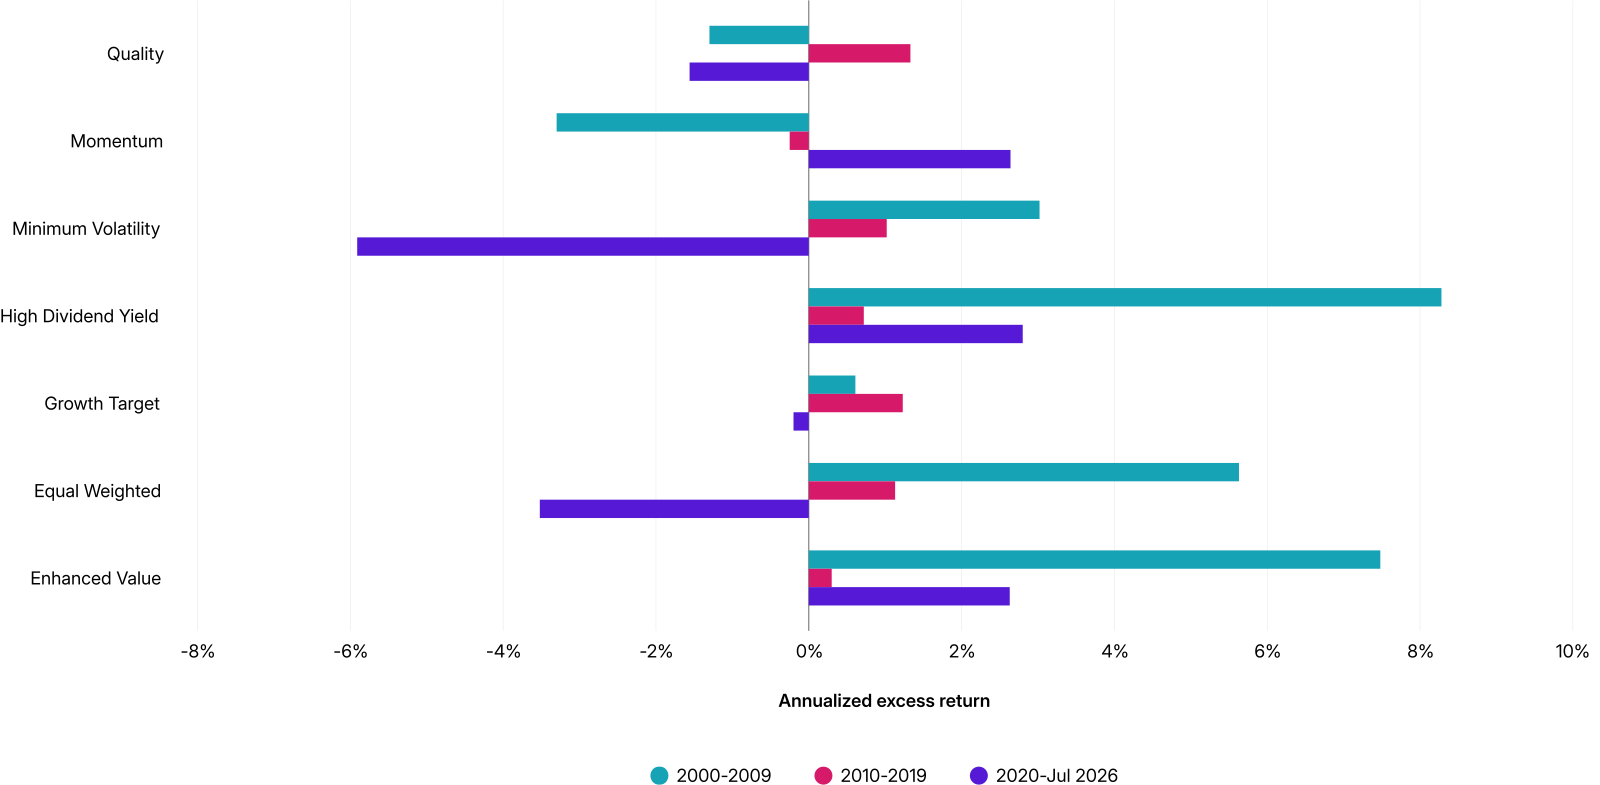
Annualized excess returns of the MSCI Japan Factor Indexes relative to the MSCI Japan Index for January 2000–December 2009, January 2010–December 2019 and January 2020–July 2026. Returns are gross and denominated in JPY.
Several MSCI Japan Factor Indexes exhibited low or negative correlations relative to the MSCI Japan Index. Enhanced Value and Quality showed an active return correlation of -0.46 over the full sample period, and Enhanced Value's correlation with Momentum was -0.23, suggesting these factors have historically exhibited complementary performance patterns.
Because factor leadership has varied across market environments, investors may benefit from combining factor indexes with different active-return correlation characteristics.
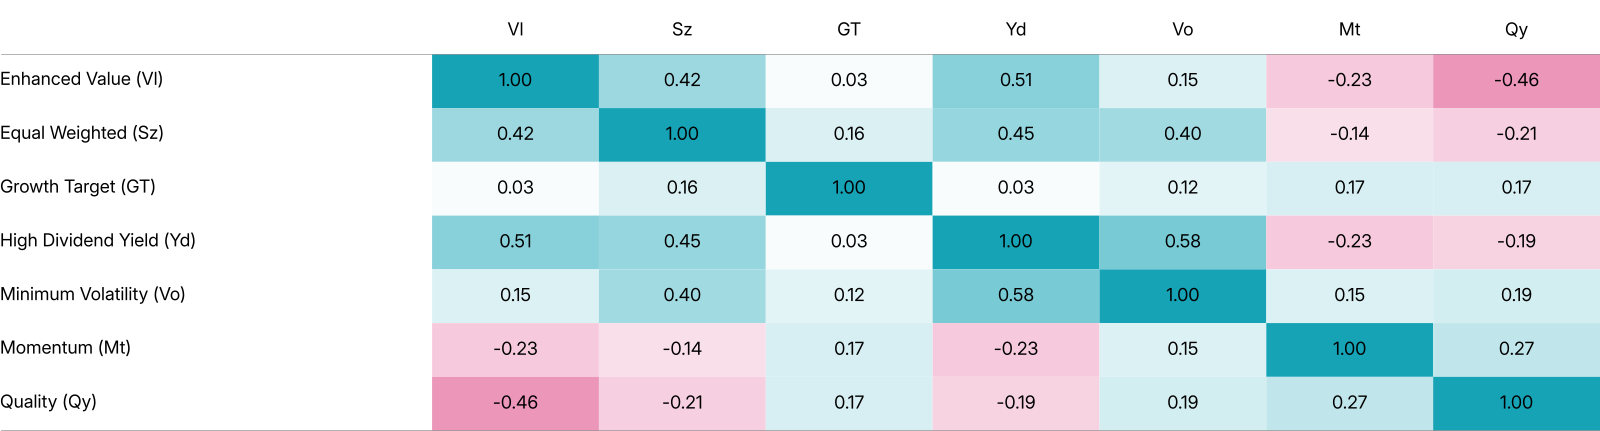
Correlations are based on monthly active returns relative to the MSCI Japan Index from January 2000 through July 2026. Returns are gross and denominated in JPY.
The following examples show how factor indexes can be incorporated into a core-satellite framework.5 Each example allocates 80% to the MSCI Japan Index and 20% to one or more factor indexes. These examples are not intended to identify an optimal allocation, but rather to demonstrate how different portfolio-construction choices can influence return and risk characteristics.
We designed these allocations to illustrate how combining factors with different active-return correlation characteristics influences portfolio outcomes. Enhanced Value served as the anchor because it had the lowest active return correlation with Quality and the lowest correlation with Momentum among the MSCI Japan Factor Indexes. High Dividend Yield was included as a contrasting example because it had a much higher active return correlation with Enhanced Value. Each of the four factors is also shown standalone at 20%, so that every combination can be compared against its components.
The stand-alone allocations also make the diversification effects easier to compare directly. Each of the three two-factor blends with Enhanced Value had a higher information ratio (IR) than the average of its stand-alone components. The benefit of lower correlation was more pronounced in the active return/|maximum drawdown| ratio.6 The higher-correlation Enhanced Value–High Dividend Yield blend improved this ratio only modestly, to 0.20 from a standalone average of 0.19, compared with 0.16 versus 0.08 for Enhanced Value–Quality and 0.14 versus 0.07 for Enhanced Value–Momentum. The three-factor allocation showed a similar pattern, with an IR of 0.53 versus a weighted component average of 0.32 and an active return/|maximum drawdown| ratio of 0.20 versus 0.07. It also had the lowest tracking error and smallest maximum drawdown of any allocation shown.
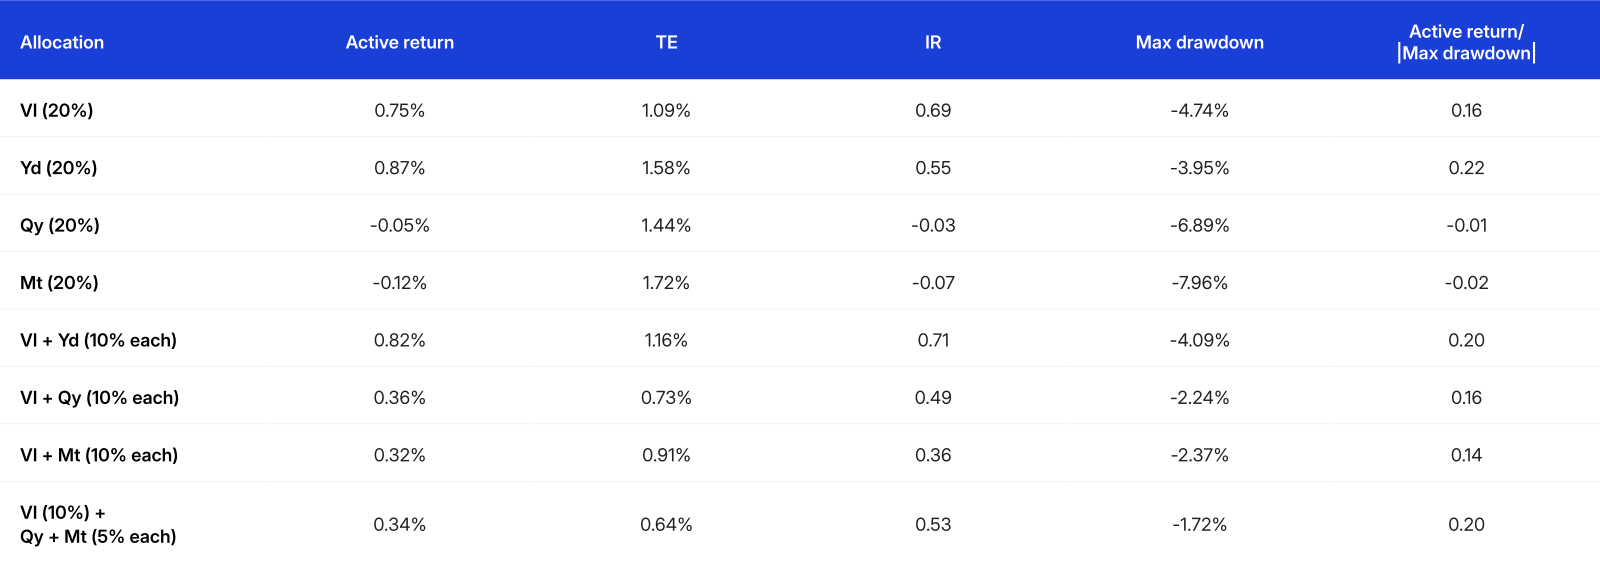
Portfolios are rebalanced semiannually at the end of May and November. Results are based on gross daily returns in JPY from January 2000 through July 2026. Active return, tracking error (TE), information ratio (IR) and maximum drawdown are calculated relative to the MSCI Japan Index. Abbreviations: Vl = Enhanced Value; Yd = High Dividend Yield; Qy = Quality; Mt = Momentum.
Across the same three sub-periods, the correlations underlying these allocations remained unchanged in sign. Enhanced Value's correlation with High Dividend Yield stayed positive in every period, while its correlations with Quality and Momentum stayed negative, deepening in the most recent period to -0.77 and -0.50. This provides additional context for the illustrative allocations, which were constructed using correlations measured over the full sample period.
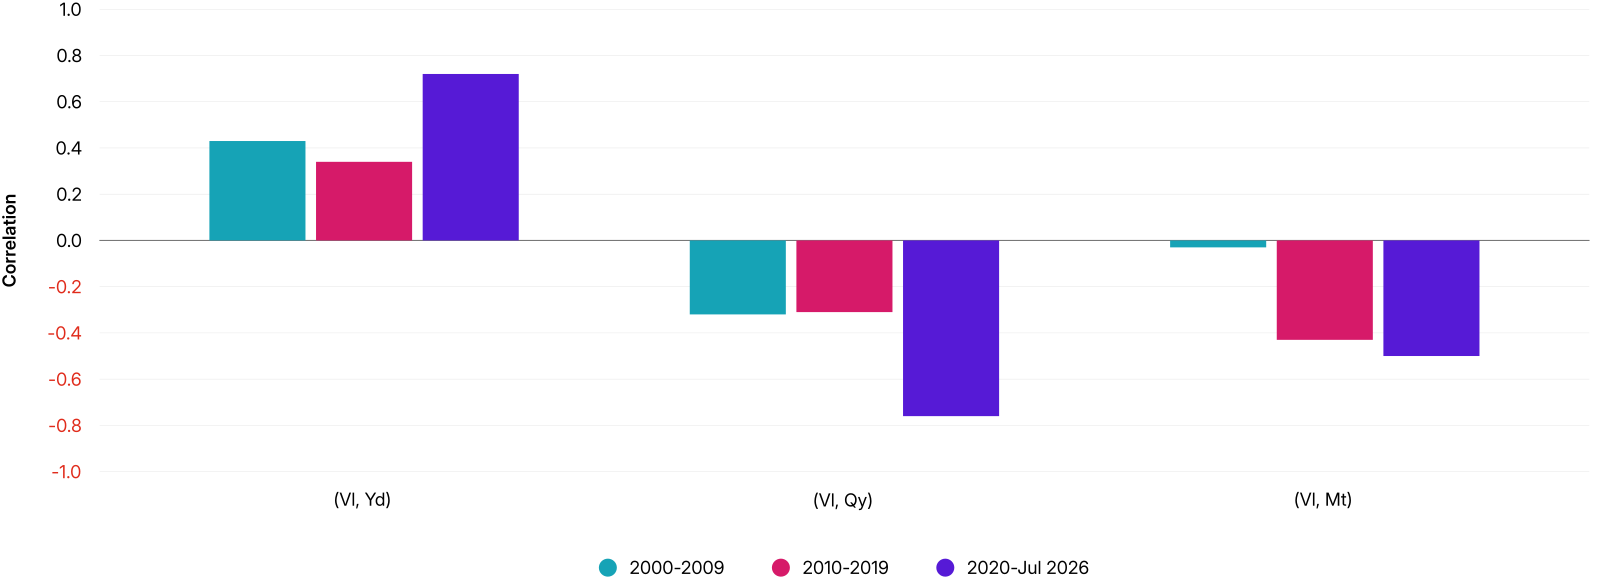
Correlations of monthly active returns relative to the MSCI Japan Index. Sub-periods: January 2000–December 2009, January 2010–December 2019 and January 2020–July 2026. Returns are gross and denominated in JPY. Abbreviations: Vl = Enhanced Value; Yd = High Dividend Yield; Qy = Quality; Mt = Momentum.
Over more than 25 years, MSCI Japan Factor Indexes delivered average excess returns comparable to those in the U.S., and with less additional risk. Leadership rotated with Japan's macroeconomic regimes, but the correlations underlying the illustrative allocations held their sign across sub-periods. Combining factors improved risk-adjusted outcomes relative to the average of their standalone components, with lower-correlation combinations showing greater improvement relative to maximum drawdown.
For investors considering how factor strategies may be incorporated into Japanese equity portfolios, these findings highlight the potential role of combining factor indexes with different active-return correlation characteristics to reduce dependence on a single factor cycle.

Subscribe todayto have insights delivered to your inbox.
Are You Really Capturing the Right Factors? Unlocking Deeper Insights in China A-Share Factor Investing
China’s A-share market offers distinct factor premia. Our research shows how tailored, multi-factor strategies can capture these insights and build stronger, more resilient portfolios.
Exploring Factor Investing in Emerging Markets
Following up on a recent MSCI survey that revealed uncertainty among investors about the comparative risk-and-return benefits of EM and DM factor investing, we simulated the performance of six common EM factor indexes over the last two decades.
1 As of Dec. 31, 2021, the global strategic-beta ETP market comprised 1,365 ETPs with USD 1.65 trillion in assets under management, compared with 27 ETPs and USD 29.2 billion in assets in Japan. “A Global Guide to Strategic-Beta Exchange-Traded Products,” Morningstar Manager Research, June 2022.
2 Matthias X. Hanauer, “Is Japan Different? Evidence on Momentum and Market Dynamics,” SSRN Working Paper, Dec. 5, 2013.
3 Andy C.W. Chui, Sheridan Titman, and K.C. John Wei, “Individualism and Momentum around the World,” Journal of Finance 65, no. 1 (2010): 361-392.
4 Abenomics consisted of “three arrows”: bold monetary policy, flexible fiscal policy and a growth strategy to promote private investment. Haruhiko Kuroda, “The Battle Against Deflation: The Evolution of Monetary Policy and Japan's Experience,” Bank of Japan, April 13, 2016.
5 Illustration only, not indicative of actual results. This analysis includes hypothetical, backtested or simulated performance results. There are frequently material differences between backtested or simulated performance results and actual results subsequently achieved by any investment strategy.
6 |Maximum drawdown| uses the absolute value because the ratio measures active return relative to the magnitude of the drawdown. Active return remains signed because its sign indicates outperformance or underperformance.
The content of this page is for informational purposes only and is intended for institutional professionals with the analytical resources and tools necessary to interpret any performance information. Nothing herein is intended to recommend any product, tool or service. For all references to laws, rules or regulations, please note that the information is provided “as is” and does not constitute legal advice or any binding interpretation. Any approach to comply with regulatory or policy initiatives should be discussed with your own legal counsel and/or the relevant competent authority, as needed.