What out-of-cycle write-downs may mean for real estate yields
- Several Australian pension funds recently announced an out-of-cycle valuation adjustment to their real estate portfolios, writing down asset values by up to 10%.
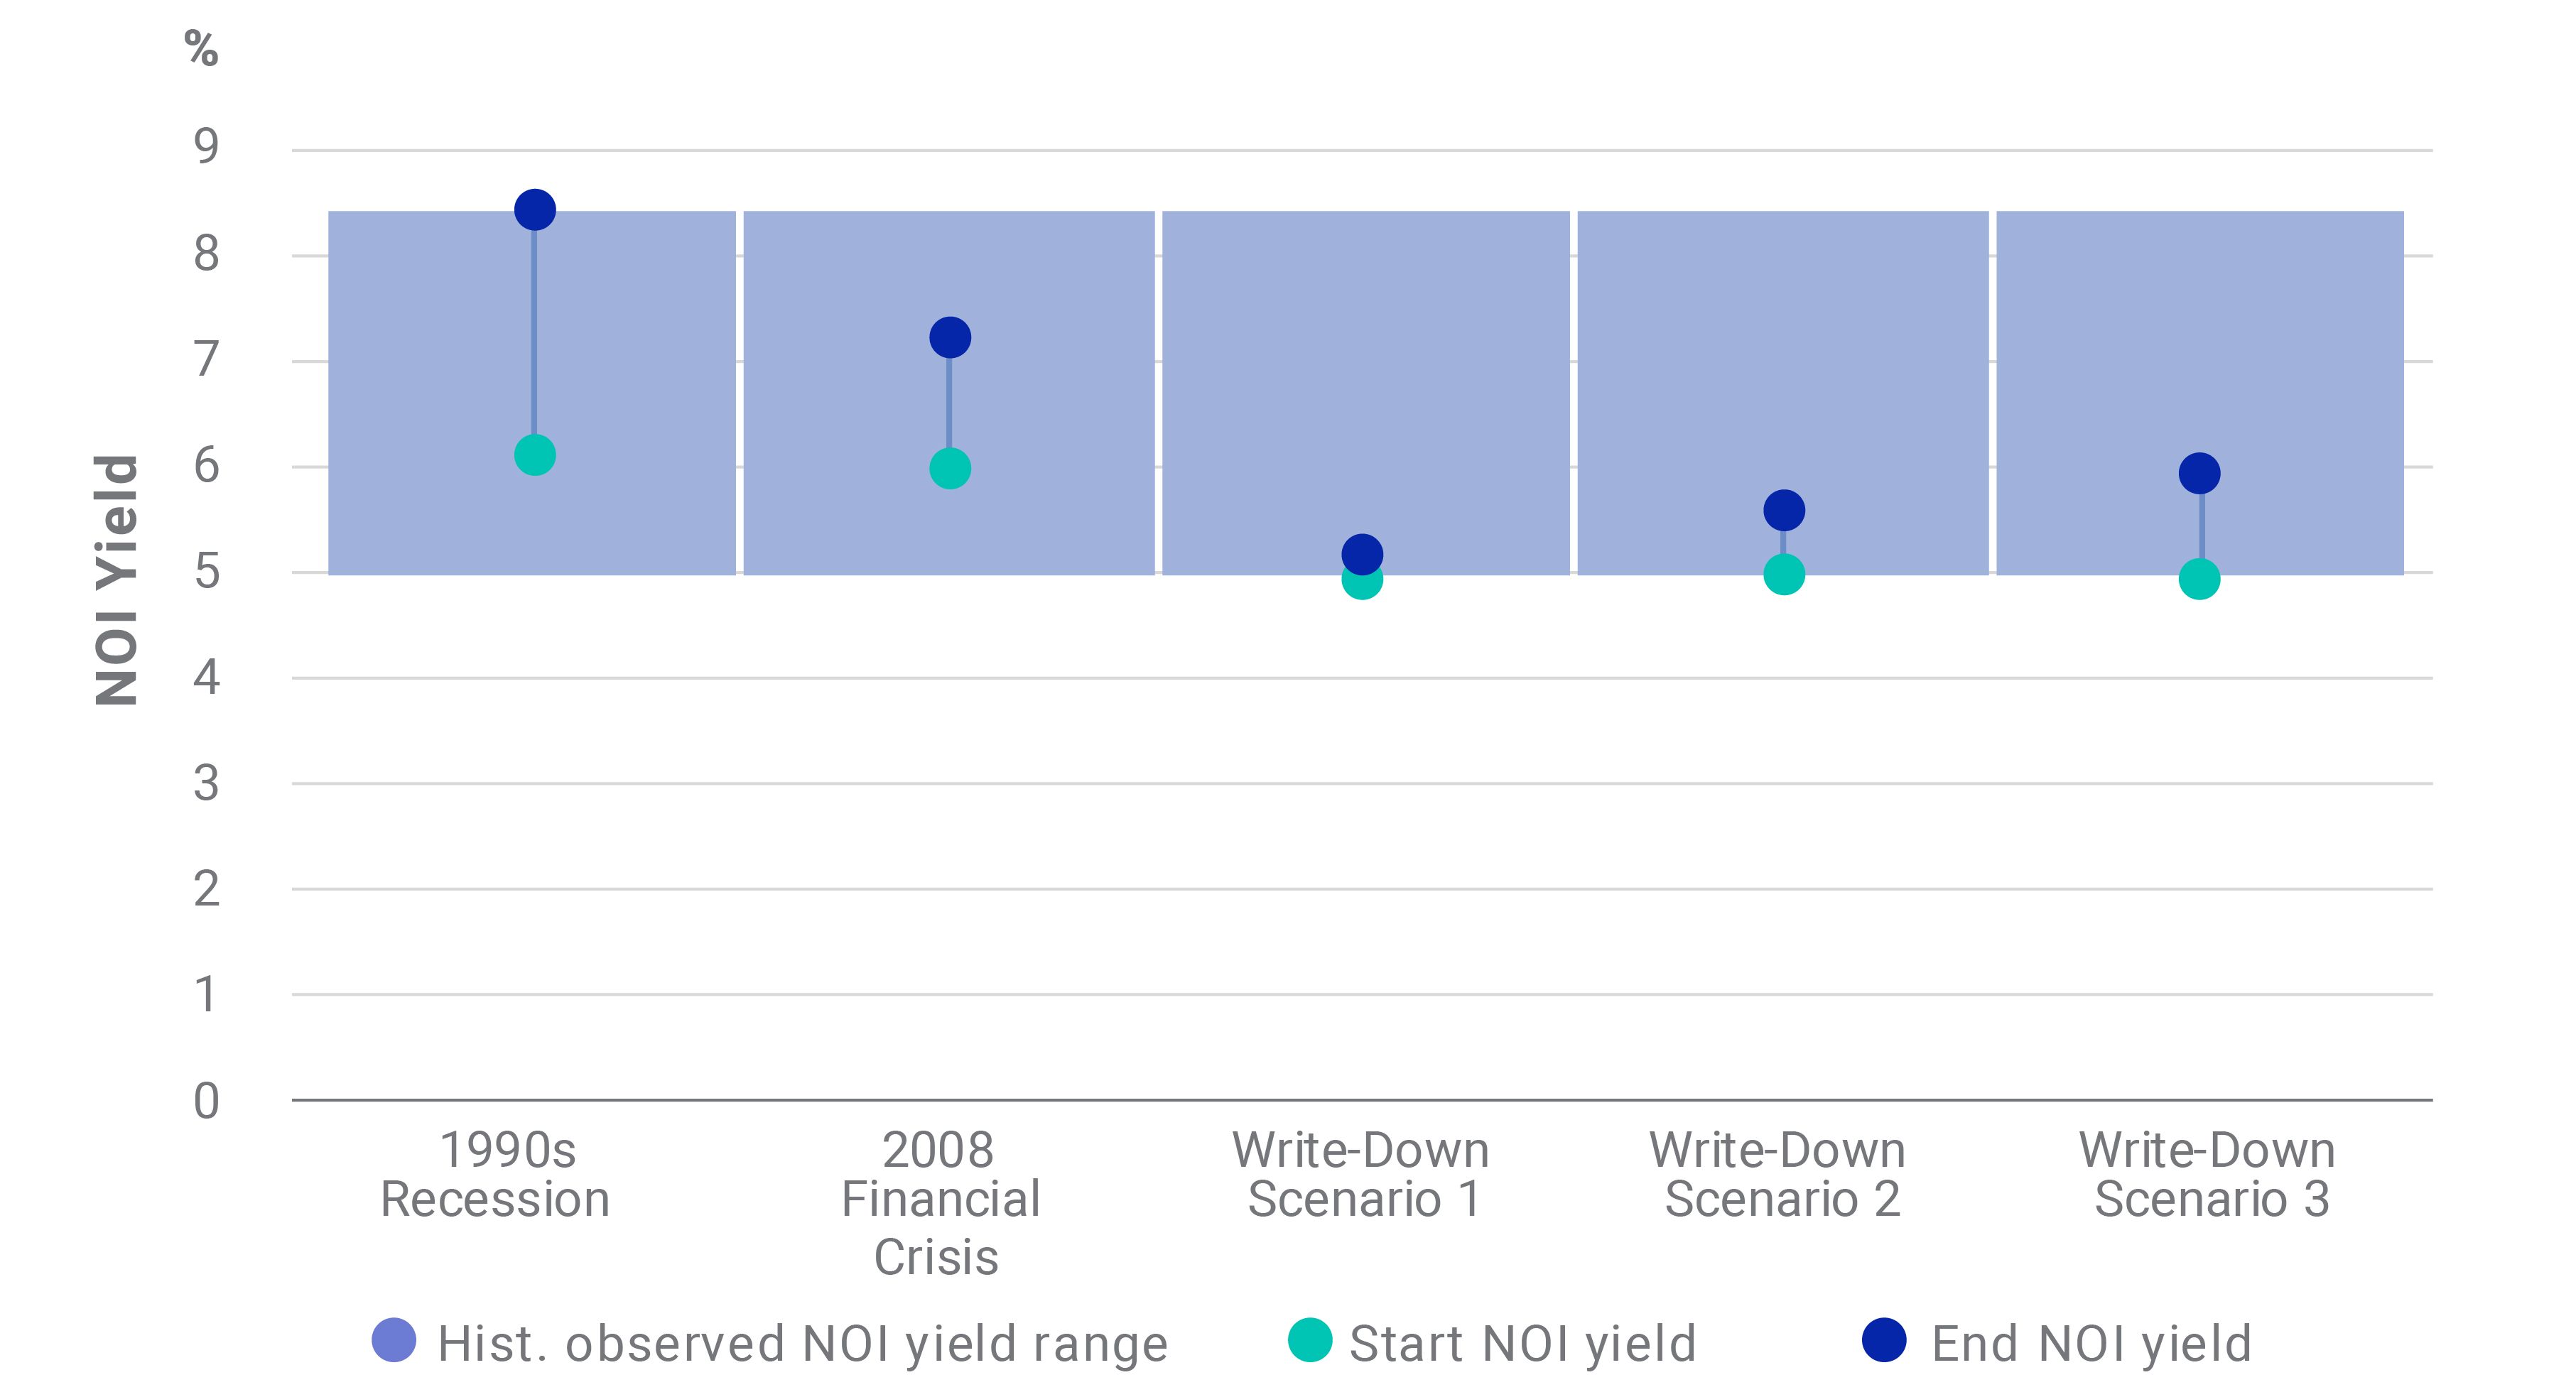
- We extrapolated what this information could mean for Australian real estate yields under different income-growth scenarios and compared the results to past corrections.
- A 10% write-down in our scenarios could indicate that asset values return to levels last seen in late 2017, but imply a relatively modest increase in yields compared to the global financial crisis or the early 1990s recession.
Unnamed: 0 | 1990s RECESSION | 2008 FINANCIAL CRISIS |
|---|---|---|
Unnamed: 0 Asset Value Growth | 1990s RECESSION -32% | 2008 FINANCIAL CRISIS -13% |
Unnamed: 0 NOI Yield Impact | 1990s RECESSION -27% | 2008 FINANCIAL CRISIS -17% |
Unnamed: 0 NOI Growth | 1990s RECESSION -6% | 2008 FINANCIAL CRISIS 5% |
Unnamed: 0 Start NOI yield | 1990s RECESSION 6.1% | 2008 FINANCIAL CRISIS 6.0% |
Unnamed: 0 End NOI yield | 1990s RECESSION 8.4% | 2008 FINANCIAL CRISIS 7.2% |
Unnamed: 0 | 1990s RECESSION | 2008 FINANCIAL CRISIS | WRITE-DOWN SCENARIO 1 | WRITE-DOWN SCENARIO 2 | WRITE-DOWN SCENARIO 3 |
|---|---|---|---|---|---|
Unnamed: 0 Asset Value Growth | 1990s RECESSION -32% | 2008 FINANCIAL CRISIS -13% | WRITE-DOWN SCENARIO 1 -10% | WRITE-DOWN SCENARIO 2 -10% | WRITE-DOWN SCENARIO 3 -10% |
Unnamed: 0 NOI Yield Impact | 1990s RECESSION -27% | 2008 FINANCIAL CRISIS -17% | WRITE-DOWN SCENARIO 1 -4% | WRITE-DOWN SCENARIO 2 -10% | WRITE-DOWN SCENARIO 3 -15% |
Unnamed: 0 NOI Growth | 1990s RECESSION -6% | 2008 FINANCIAL CRISIS 5% | WRITE-DOWN SCENARIO 1 -6% | WRITE-DOWN SCENARIO 2 0% | WRITE-DOWN SCENARIO 3 5% |
Unnamed: 0 Start NOI yield | 1990s RECESSION 6.1% | 2008 FINANCIAL CRISIS 6.0% | WRITE-DOWN SCENARIO 1 5.0% | WRITE-DOWN SCENARIO 2 5.0% | WRITE-DOWN SCENARIO 3 5.0% |
Unnamed: 0 End NOI yield | 1990s RECESSION 8.4% | 2008 FINANCIAL CRISIS 7.2% | WRITE-DOWN SCENARIO 1 5.2% | WRITE-DOWN SCENARIO 2 5.6% | WRITE-DOWN SCENARIO 3 5.9% |
Unnamed: 0 Yield increase (bps) | 1990s RECESSION 230 | 2008 FINANCIAL CRISIS 120 | WRITE-DOWN SCENARIO 1 20 | WRITE-DOWN SCENARIO 2 60 | WRITE-DOWN SCENARIO 3 90 |
Unnamed: 0 Yield increase (%) | 1990s RECESSION 38% | 2008 FINANCIAL CRISIS 20% | WRITE-DOWN SCENARIO 1 4% | WRITE-DOWN SCENARIO 2 12% | WRITE-DOWN SCENARIO 3 18% |

Subscribe todayto have insights delivered to your inbox.
The content of this page is for informational purposes only and is intended for institutional professionals with the analytical resources and tools necessary to interpret any performance information. Nothing herein is intended to recommend any product, tool or service. For all references to laws, rules or regulations, please note that the information is provided “as is” and does not constitute legal advice or any binding interpretation. Any approach to comply with regulatory or policy initiatives should be discussed with your own legal counsel and/or the relevant competent authority, as needed.