What’s the downside in real estate?

Blog post
October 4, 2019
  • Real estate is a cyclical asset class, and investors are exposed to potentially dramatic falls in asset values. But every cycle is different, and turning points have historically been hard to predict.
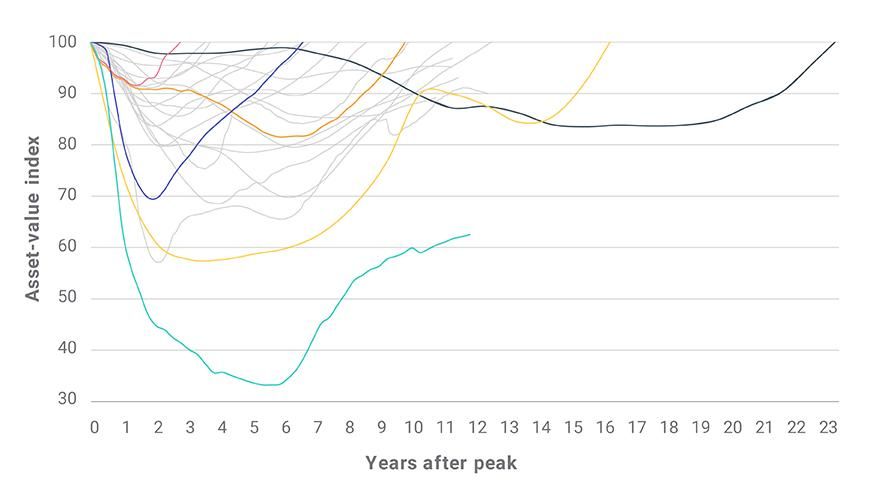
  • MSCI data shows that falls in asset values have been relatively infrequent, but have also varied considerably in their magnitude and duration.
  • While falling asset values are a risk to investor portfolios, diversification and income returns have in the past provided investors with some protection.
With inelastic supply and a strong correlation to economic growth, real estate has always been a cyclical asset class, with periods of expansion followed by sometimes painful corrections. That every cycle is different poses a challenge for investors, and it has proven extremely hard to predict turning points. However, investors may seek to mitigate their exposure to downside risk through diversification and long lease-driven income returns. The graphic below uses data from MSCI's Global Annual Property Index, as well as several other national-market indexes, to compare past downturns in which asset values fell by more than 5%. The results show that, while corrections have occurred relatively infrequently, they have varied considerably in their magnitude and duration.
Property markets have corrected and recovered in a variety of ways
Country
Peak
Trough
Recovery
Max asset-value fall
Country

Ireland

Peak

Dec 1984

Trough

Dec 1986

Recovery

Dec 1988

Max asset-value fall

-7%

Country

U.K.

Peak

Nov 1989

Trough

May 1993

Recovery

Jul 1999

Max asset-value fall

-25%

Country

Australia

Peak

Dec 1989

Trough

Sep 1993

Recovery

Mar 2002

Max asset-value fall

-32%

Country

Sweden

Peak

Dec 1990

Trough

Dec 1994

Recovery

Dec 2006

Max asset-value fall

-43%

Country

Ireland

Peak

Dec 1990

Trough

Dec 1993

Recovery

Jun 1996

Max asset-value fall

-14%

Country

Germany

Peak

Dec 1995

Trough

Dec 2010

Recovery

Dec 2018

Max asset-value fall

-17%

Country

U.K.

Peak

Jun 2007

Trough

Jul 2009

Recovery

Ongoing

Max asset-value fall

-43%

Country

Ireland

Peak

Dec 2007

Trough

Mar 2013

Recovery

Ongoing

Max asset-value fall

-67%

Country

Spain

Peak

Dec 2007

Trough

Dec 2013

Recovery

Dec 2018

Max asset-value fall

-30%

Country

Portugal

Peak

Dec 2007

Trough

Dec 2013

Recovery

Ongoing

Max asset-value fall

-21%

Country

Global Index

Peak

Dec 2007

Trough

Dec 2009

Recovery

Dec 2015

Max asset-value fall

-20%

Country

France

Peak

Dec 2007

Trough

Dec 2009

Recovery

Jun 2016

Max asset-value fall

-16%

Country

Sweden

Peak

Dec 2007

Trough

Dec 2009

Recovery

Dec 2011

Max asset-value fall

-9%

Country

Norway

Peak

Dec 2007

Trough

Dec 2009

Recovery

Dec 2014

Max asset-value fall

-8%

Country

Belgium

Peak

Dec 2007

Trough

Dec 2013

Recovery

Ongoing

Max asset-value fall

-7%

Country

Japan

Peak

Feb 2008

Trough

Nov 2012

Recovery

Ongoing

Max asset-value fall

-22%

Country

U.S.

Peak

Mar 2008

Trough

Mar 2010

Recovery

Dec 2014

Max asset-value fall

-31%

Country

New Zealand

Peak

Mar 2008

Trough

Jun 2011

Recovery

Dec 2014

Max asset-value fall

-13%

Country

Australia

Peak

Mar 2008

Trough

Dec 2009

Recovery

Dec 2013

Max asset-value fall

-13%

Country

Italy

Peak

Jun 2008

Trough

Dec 2015

Recovery

Ongoing

Max asset-value fall

-15%

Country

Netherlands

Peak

Sep 2008

Trough

Jun 2014

Recovery

Jun 2018

Max asset-value fall

-19%

Country

Canada

Peak

Sep 2008

Trough

Mar 2010

Recovery

Jun 2011

Max asset-value fall

-8%

Real estate corrected less often than stocks
Corrections in real estate have occurred relatively infrequently. For instance, since its inception in December 1998, the MSCI U.S. Quarterly Property Index's asset values have fallen only twice — by 3% after the dot-com bubble burst in 2001 and by 31% during the global financial crisis. By contrast, equity benchmark the MSCI USA Index, measured quarterly, saw five periods where index levels declined for two or more consecutive quarters between December 1998 and June 2019. However, the explanation probably lies at least partially in the illiquid nature of commercial real estate and the appraisal smoothing in valuation-based real estate indexes. Most of the real estate corrections on record are correlated with recessions. Of the 21 national-market corrections in the table above, 19 coincided with economic recessions. The most pronounced fall occurred in Ireland in the aftermath of the global financial crisis. Asset values there fell by 67% over 21 quarters; and after a further 25 quarters, asset values were still 38% below their pre-crisis peak. Another large fall in asset values occurred after the Swedish banking crisis in the early 1990s, when Swedish asset values fell by 43% over four years and then took another 12 years to return to their prior peak. While the corrections in Ireland and Sweden were severe, it is important to note that the timing, magnitude and duration of asset-value falls have varied considerably. For that reason, international diversification may have provided investors with a means to mitigate their exposure to asset-value falls.
Diversification and income steadied returns
Even within countries, geographic diversification and property type may also have helped asset owners reduce their exposure to the most severe asset-value falls. For example, while asset values in the U.S. fell by 3% overall after the dot-com bubble burst, office asset values saw a peak-to-trough fall of 7%, while retail asset values increased by 11% over the same period. Similarly, office assets in San Francisco lost 20% of their value between March 2001 and September 2003, but office assets in New York City increased in value by 1% over the same period. We should note that even when asset values have fallen, income returns provided some support to investors. While asset values in Ireland were still 38% below their pre-financial-crisis peak, as of June 2019, total returns of the MSCI Ireland Quarterly Property Index rose by 30% from its pre-crisis peak and generated a positive annualized total return of 2.3% over that period. That said, with income returns at historical lows in many markets, income returns may not provide the same level of cushioning that they did in the past. In a low-income environment, investors can still consider greater diversification as a way to mitigate their downside risk.
Further Reading

Subscribe today
to have insights delivered to your inbox.

The content of this page is for informational purposes only and is intended for institutional professionals with the analytical resources and tools necessary to interpret any performance information. Nothing herein is intended to recommend any product, tool or service. For all references to laws, rules or regulations, please note that the information is provided “as is” and does not constitute legal advice or any binding interpretation. Any approach to comply with regulatory or policy initiatives should be discussed with your own legal counsel and/or the relevant competent authority, as needed.