
An Argument for Not Fearing the Relative Slowdown in US Deal Activity
U.S. commercial property sales grew 14% year over year in the second quarter of 2026, though dropped relative to the first quarter of the year.1 This relative decline is not a certain sign of gloom and doom, but likely rather an investor reaction to lower levels of returns in the current market. When investment returns are high and climbing, investors will often get interested in a sector and jump in to chase those gains. The chart shows that returns in commercial real estate are simply less exciting than they were in the past.
With the exception of retail, returns over the last four quarters have trended well below levels seen from 2015 to 2019, when the economy was growing and social distancing was a term none of us had heard.
So rather than gloom and doom, the slowdown in deal volume looks like a simple leveling off of deal flow following the market's recovery phase. Without falling interest rates, the wind is not at one’s back on cap rates. And without a strong signal from the economy, the income side will not be as robust. Deals will likely still happen, but it is more of a stock picker's market.
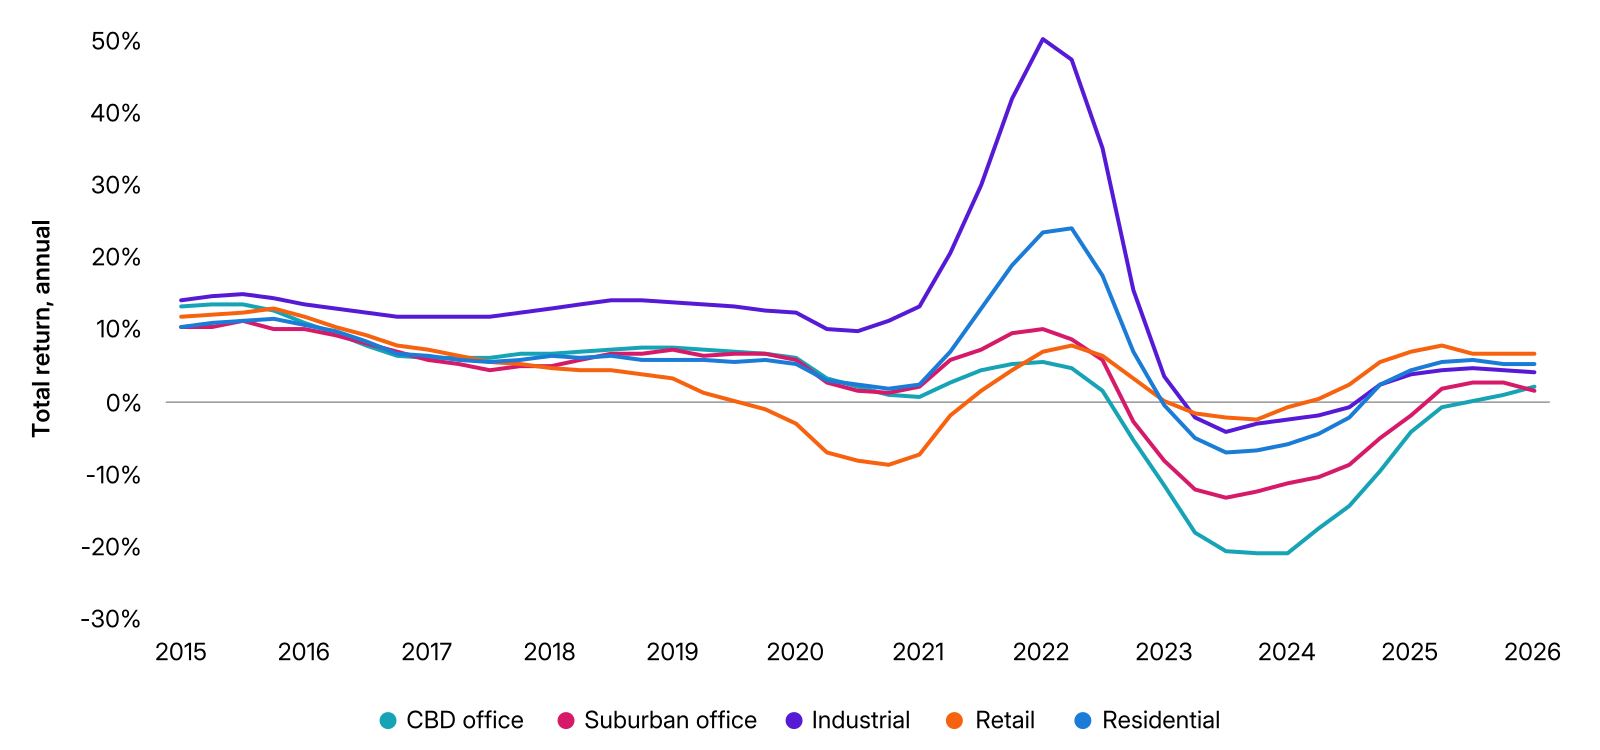
Data through Q2 2026. Source: MSCI U.S. Quarterly Property Index via MSCI Real Assets MCP

Subscribe todayto have insights delivered to your inbox.
Real Capital Analytics
Transparent, proprietary intelligence across global private real estate markets connecting investors, funds, assets and transactions on one platform.
Real Estate in Focus: US
Listen to MSCI’s leading research experts share their insights into market trends.
Charting private assets
Stay ahead of private markets with the latest trends in performance and capital dynamics.
1 Volume data as of Aug. 17, 2026.
The content of this page is for informational purposes only and is intended for institutional professionals with the analytical resources and tools necessary to interpret any performance information. Nothing herein is intended to recommend any product, tool or service. For all references to laws, rules or regulations, please note that the information is provided “as is” and does not constitute legal advice or any binding interpretation. Any approach to comply with regulatory or policy initiatives should be discussed with your own legal counsel and/or the relevant competent authority, as needed.