Emerging Markets Boost Global Equity Supply
Rather than a trend toward de-equitization, our research found the global number of publicly traded firms has grown steadily for more than two decades — although with some regional variation.
The number of publicly listed securities in emerging markets (EM) jumped roughly 100%, driven by capital markets' growth in nations such as China and India. In contrast, the universe of publicly listed companies in developed markets (DM) has declined. In the U.S., the number declined sharply from 1998 to 2010, but since the COVID-19 pandemic it has begun to nudge higher.
Diverging trends in regional equity supply
Market cap and corporate earnings in EM outpaced the same measures in DM over the last 22 years, from June 2002 through April 2024. Although EM posted 13% annualized earnings growth (versus 8% for DM), earnings per share (EPS) lagged DM. This gap could be partially explained by the prevalence of share issuances and initial public offerings in EM to raise new capital, which led to a negative buyback yield over much of the last two decades, as well as to the dramatic growth in supply.
In the U.S., however, companies' preference to redistribute profits through share buybacks has led to shrinking supply. The result has been a positive buyback yield for most of the last 20 years, which has encouraged EPS growth. DM excluding the U.S. also had a higher buyback yield than EM, although it was mostly negative over the last two decades, turning positive in early 2023.
Changes in the number of publicly listed companies impact the market breadth available for investors, while buyback yields may influence EPS growth for better or worse. Understanding these distinctions of regional equity supply in EM and DM and the reasons for them can help investors make informed decisions regarding their portfolios.
Surging EM issuance has led global equity supply higher
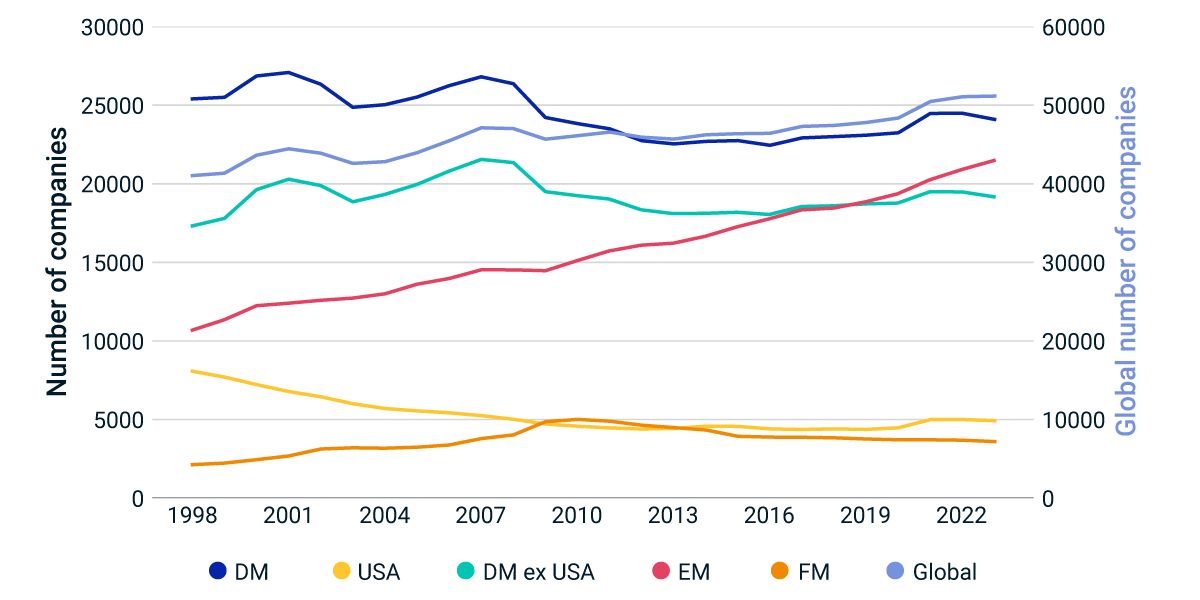
The data period is from 1998 to 2023. The number of companies is measured at year-end and excludes the over-the-counter market. The counts shown for DM, DM ex USA, EM and FM regions are based on all valid listed securities within the markets classified as eligible for the MSCI World, MSCI World ex USA, MSCI Emerging Markets and MSCI Frontier Markets Indexes, respectively.
Buyback yield has largely remained positive for US and negative for EM over the last 20 years
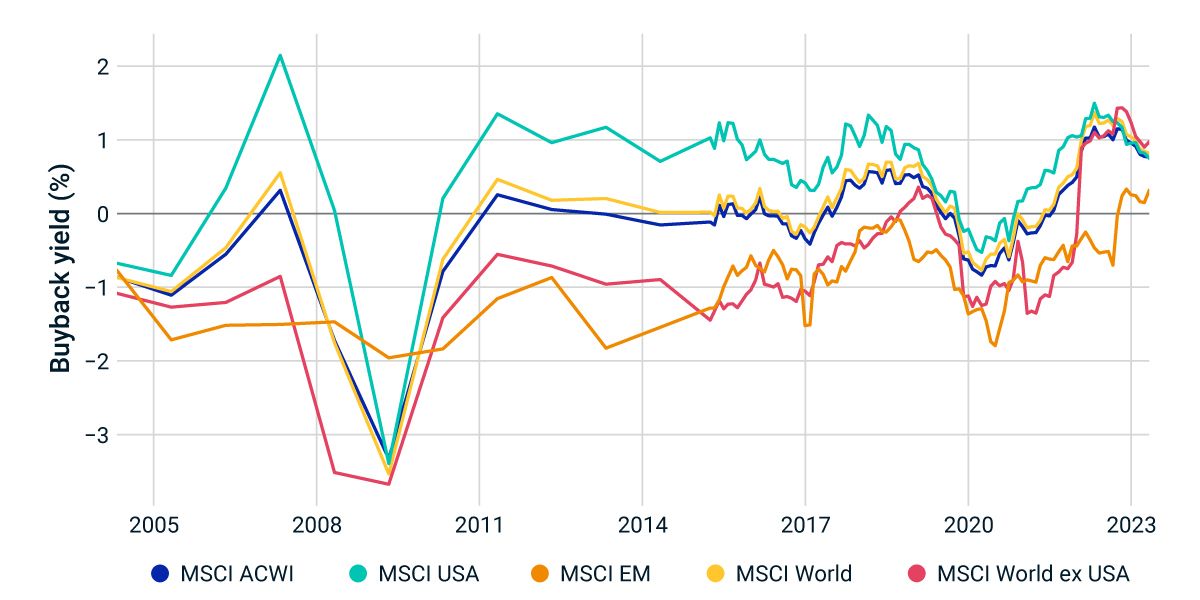
The data period is from April 29, 2005, to April 30, 2024. Index buyback yield is the weighted average of the index’s constituents’ buyback yields at month-end (annual frequency prior to April 2016) calculated as follows: issuer net buyback yield = ∑ 𝑊𝑖 ∗𝑌𝑖 , where 𝑊𝑖 is the market-capitalization weight of a common share for an issuer with n securities, and 𝑌𝑖 is the buyback yield of a common share calculated as the change in the trailing 12-month number of shares/current number of shares. Please refer to MSCI Buyback Yield Indexes Methodology for more detail.


Subscribe todayto have insights delivered to your inbox.
The content of this page is for informational purposes only and is intended for institutional professionals with the analytical resources and tools necessary to interpret any performance information. Nothing herein is intended to recommend any product, tool or service. For all references to laws, rules or regulations, please note that the information is provided “as is” and does not constitute legal advice or any binding interpretation. Any approach to comply with regulatory or policy initiatives should be discussed with your own legal counsel and/or the relevant competent authority, as needed.