How Concentrated Are Small Caps Today?
Small-cap stocks have historically outperformed large- and mid-cap stocks, especially after recessions and over longer holding periods, despite having higher volatility. Their strong performance has not been linked to higher concentration risk, however, which has been associated with large-cap stocks. Concentration risk arises when a substantial portion of a portfolio is invested in the shares of a few companies.
Two ways to measure concentration risk
To gauge a portfolio's concentration level, we can calculate the ratio of the portfolio's effective number of stocks to total number of stocks.1 The ratio summarizes the weight distribution of a portfolio: the lower the ratio, the more concentrated the index.
Across regions (represented by the MSCI USA, MSCI World ex USA and MSCI Emerging Markets Indexes), the ratio was much higher for small-cap indexes, indicating lower concentration risk compared to the corresponding regional parent indexes.
An alternative way to assess portfolio concentration is asset-level risk-contribution analysis. As of Sept. 29, 2023, the top 10 index constituents of the MSCI USA Small Cap, MSCI World ex USA Small Cap and MSCI Emerging Markets Small Cap Indexes contributed a much smaller portion of total index risk — 3.0%, 2.8% and 4.1%, respectively — than the portion contributed by the top 10 constituents of their parent index — 35.3%, 12.9% and 28.4%, respectively. Thus, the addition of small-cap allocations to more concentrated larger-cap portfolios could be a potentially diversifying strategy.
Small caps shown to be less concentrated than large caps
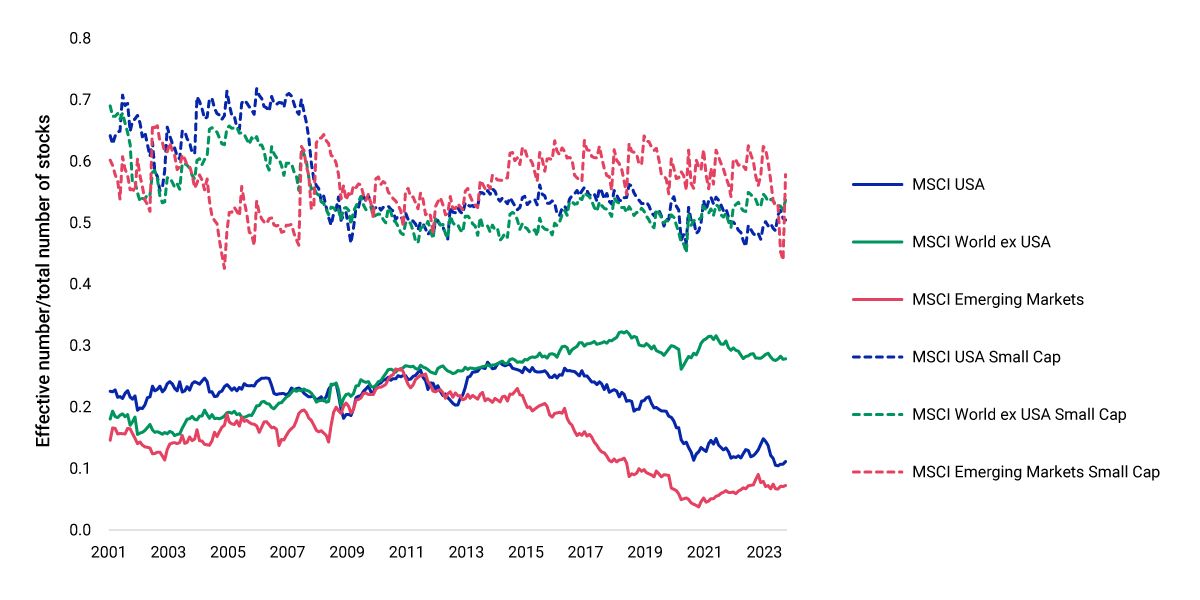
The effective number of stocks is a measure of index concentration, ranging between 1 (for a single stock) and the total number of stocks in the index (in the case of an equally weighted index). The ratio of the effective number of stocks to the total number of stocks summarizes the weight distribution of an index. Monthly data from January 2001 to September 2023.


Subscribe todayto have insights delivered to your inbox.
The Ups and Downs of Small Caps and Inflation
Inflation appears to have peaked at the end of 2022, but it remains influential in capital markets. We analyzed nearly 50 years of data to assess how small caps’ performance has changed with shifts in both the level and trend of inflation.
Small Caps Have Been a Big Story After Recessions
Some investors are already evaluating opportunities offered by a post-slowdown world. One of these opportunities is small-cap stocks, which have historically outperformed large caps, especially after recessions.
Factor Performance amid Concentration Shifts
Noting the parallel between today’s technology- and AI-driven concentrated rally and the late 1990s’ technology boom, we examined factor performance and factors’ over- and underweights in the top 10 MSCI USA Index constituents over both periods.
1 The effective number of stocks is a measure of index concentration, ranging between 1 (for a single stock) and the total number of stocks in the index (in the case of an equally weighted index). The measure is calculated as the inverse of the Herfindahl-Hirschman Index.
The content of this page is for informational purposes only and is intended for institutional professionals with the analytical resources and tools necessary to interpret any performance information. Nothing herein is intended to recommend any product, tool or service. For all references to laws, rules or regulations, please note that the information is provided “as is” and does not constitute legal advice or any binding interpretation. Any approach to comply with regulatory or policy initiatives should be discussed with your own legal counsel and/or the relevant competent authority, as needed.