The Ups and Downs of Small Caps and Inflation
Inflation, like other macroeconomic factors, can influence the performance of equity markets. Inflation's impact varies across different segments of the markets and with both its level and trend. We focus here on small-cap stocks.
By the end of 2022, inflation had peaked across most of the developed world and has followed a downward trajectory over the first half of 2023. Inflation generally remains, however, above the 2% level — the target rate for central banks in many advanced nations. Based on the latest OECD data, the consumer price index (CPI) in the OECD countries was 5.7% in June,1 and the Bureau of Labor Statistics reported that U.S. CPI was 3.2% in July.2
Inflation and small-cap performance through the decades
To analyze the impact of inflation level on small-cap performance, we studied the nearly 50-year period from December 1975 through June 2023. We found that the MSCI World Small Cap Index outperformed the MSCI World Index by 0.47% per month in periods of low inflation (CPI < 2%) and by only 0.09% in periods of high inflation (CPI > 2%).
We also looked at how the inflation trend has impacted small-cap performance. We focused on high-inflation regimes only, which we divided into subperiods of rising and falling inflation. Small caps underperformed on average by 13 basis points (bps) per month when inflation was rising and outperformed by 22 bps per month when inflation was falling.
These results are in line with the expectation that easing inflation coincides with economic growth and that smaller companies tend to benefit in early phases of the business cycle. The historical performance of small caps as inflation levels and trends have shifted may provide useful context for investors seeking to align their portfolios with their inflation expectations.
Impact of inflation on small-cap performance
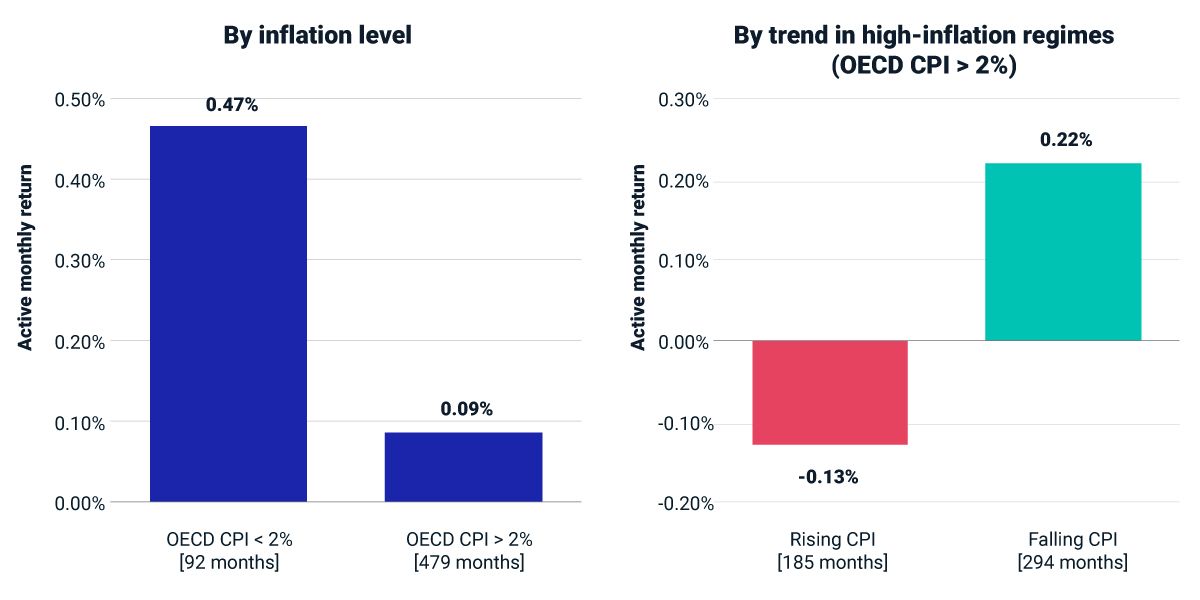
“Active monthly return” is the monthly return of the MSCI World Small Cap Index compared to the monthly return of the MSCI World Index. Rising/falling inflation regimes are defined by the sign of 36-month minus three-month OECD CPI. Through December 1998, we used the MSCI World Equal Weighted Index returns to proxy small-cap performance. Data is from December 1975 through June 2023.


Subscribe todayto have insights delivered to your inbox.
Small Caps Have Been a Big Story After Recessions
We found that small-cap firms have historically outperformed larger ones, especially after recessions and over longer holding periods.
AI’s Moment and Insights from Themes Past
The AI-driven rally has pushed today's market concentration to levels not seen since the 1970s, emphasizing the impact that a few large firms have had in shaping recent market returns.
Exploring Factor Investing in Emerging Markets
Emerging-market (EM) factor indexes have performed well long term, mirroring the pattern in developed-market (DM) factor indexes. The systematic risks and behavioral biases driving factor premia in DM may also extend to EM.
1 “Consumer Prices, OECD – Updated: 3 August 2023.” OECD, Aug. 3, 2023.', '“Consumer Price Index – July 2023.” Bureau of Labor Statistics, Aug. 10, 2023.
The content of this page is for informational purposes only and is intended for institutional professionals with the analytical resources and tools necessary to interpret any performance information. Nothing herein is intended to recommend any product, tool or service. For all references to laws, rules or regulations, please note that the information is provided “as is” and does not constitute legal advice or any binding interpretation. Any approach to comply with regulatory or policy initiatives should be discussed with your own legal counsel and/or the relevant competent authority, as needed.