In the Eye of the Tariff Storm: Hazard Exposures of US vs Global Manufacturing
Extreme-weather events occur regardless of global economic policy, posing risks of infrastructure damage and production disruptions. As tariff policies evolve, damage or disruption, particularly from tornadoes and hailstorms, could place a greater strain on U.S. manufacturing sites compared to those outside the country.
We analyzed 102,759 global manufacturing sites (of which 73,170 are in the U.S.) across seven GICS sectors to determine the physical hazards that these sites are exposed to.1
Across all sectors, U.S.-based facilities face elevated risks from acute hazards such as tornadoes, hailstorms and wildfires compared to their global counterparts, as shown in the table. Higher tornado and hailstorm risks are particularly pronounced in the materials, consumer discretionary, consumer staples and energy sectors.
A geographic concentration of hailstorms and tornadoes
Identifying sectors where manufacturing facilities face heightened physical risk relies on assessing these risks at the location level. Over one quarter (28%) of U.S. manufacturing sites have greater exposure to tornadoes or hailstorms compared to any other hazard. As the map shows, these sites are heavily concentrated in the eastern two-thirds of the country, where such events are most frequent.
Reassessing the risks
Given the elevated exposure to acute hazards, investors may need to reassess the resilience of their investments in U.S. manufacturing sectors. Proactive risk management and strategic planning can help mitigate the adverse effects of these physical climate risks.
US manufacturing sites highly exposed to tornado and hailstorms vs. non-US sites
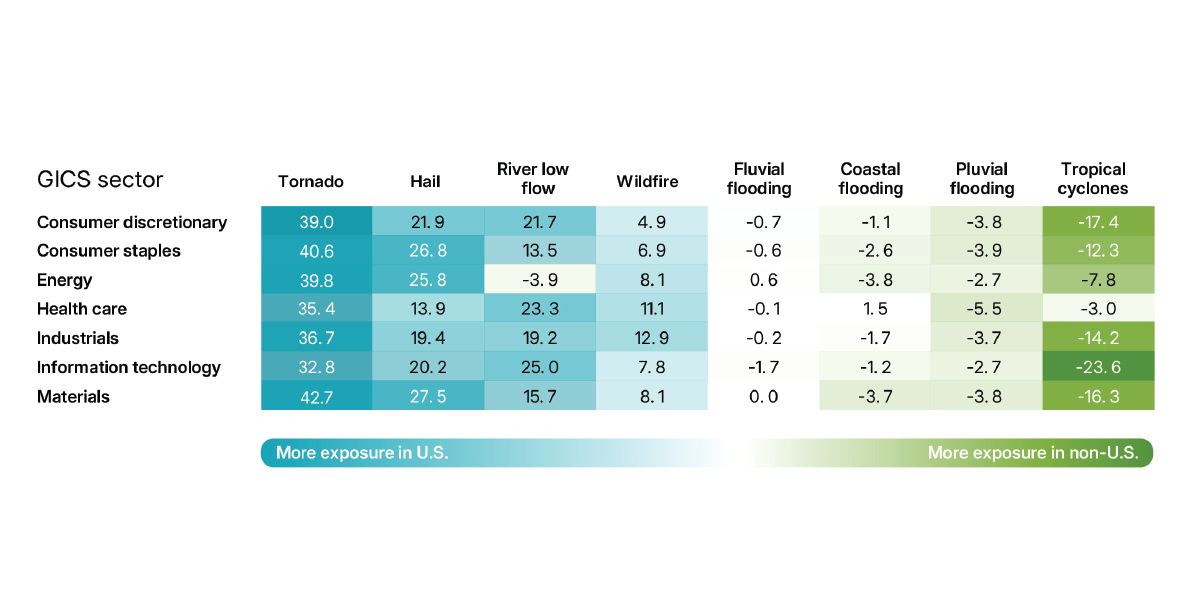
Data as of April 7, 2025. Analysis covers all manufacturing assets, as per MSCI Geospatial Asset Intelligence data, for companies in the following GICS sectors: consumer discretionary, consumer staples, energy, health care, industrials, information technology and materials. Sector-hazard heat map depicts which hazards U.S. manufacturing sites are more exposed to compared to non-U.S. manufacturing sites. Numbers indicate the difference in the average hazard percentile per hazard-sector combination of U.S. and non-U.S. assets. Hazard percentiles are between 0 and 100 and are computed based on a defined hazard level relative to current hazard levels from all asset locations of companies that are MSCI ACWI Index constituents. Blue shading indicates higher exposure to that hazard for manufacturing facilities in the U.S., whereas green shading indicates higher exposure to that hazard for facilities outside the U.S. Source: MSCI ESG Research
Tornadoes and hailstorms present highest risk to over 25% of US manufacturing assets
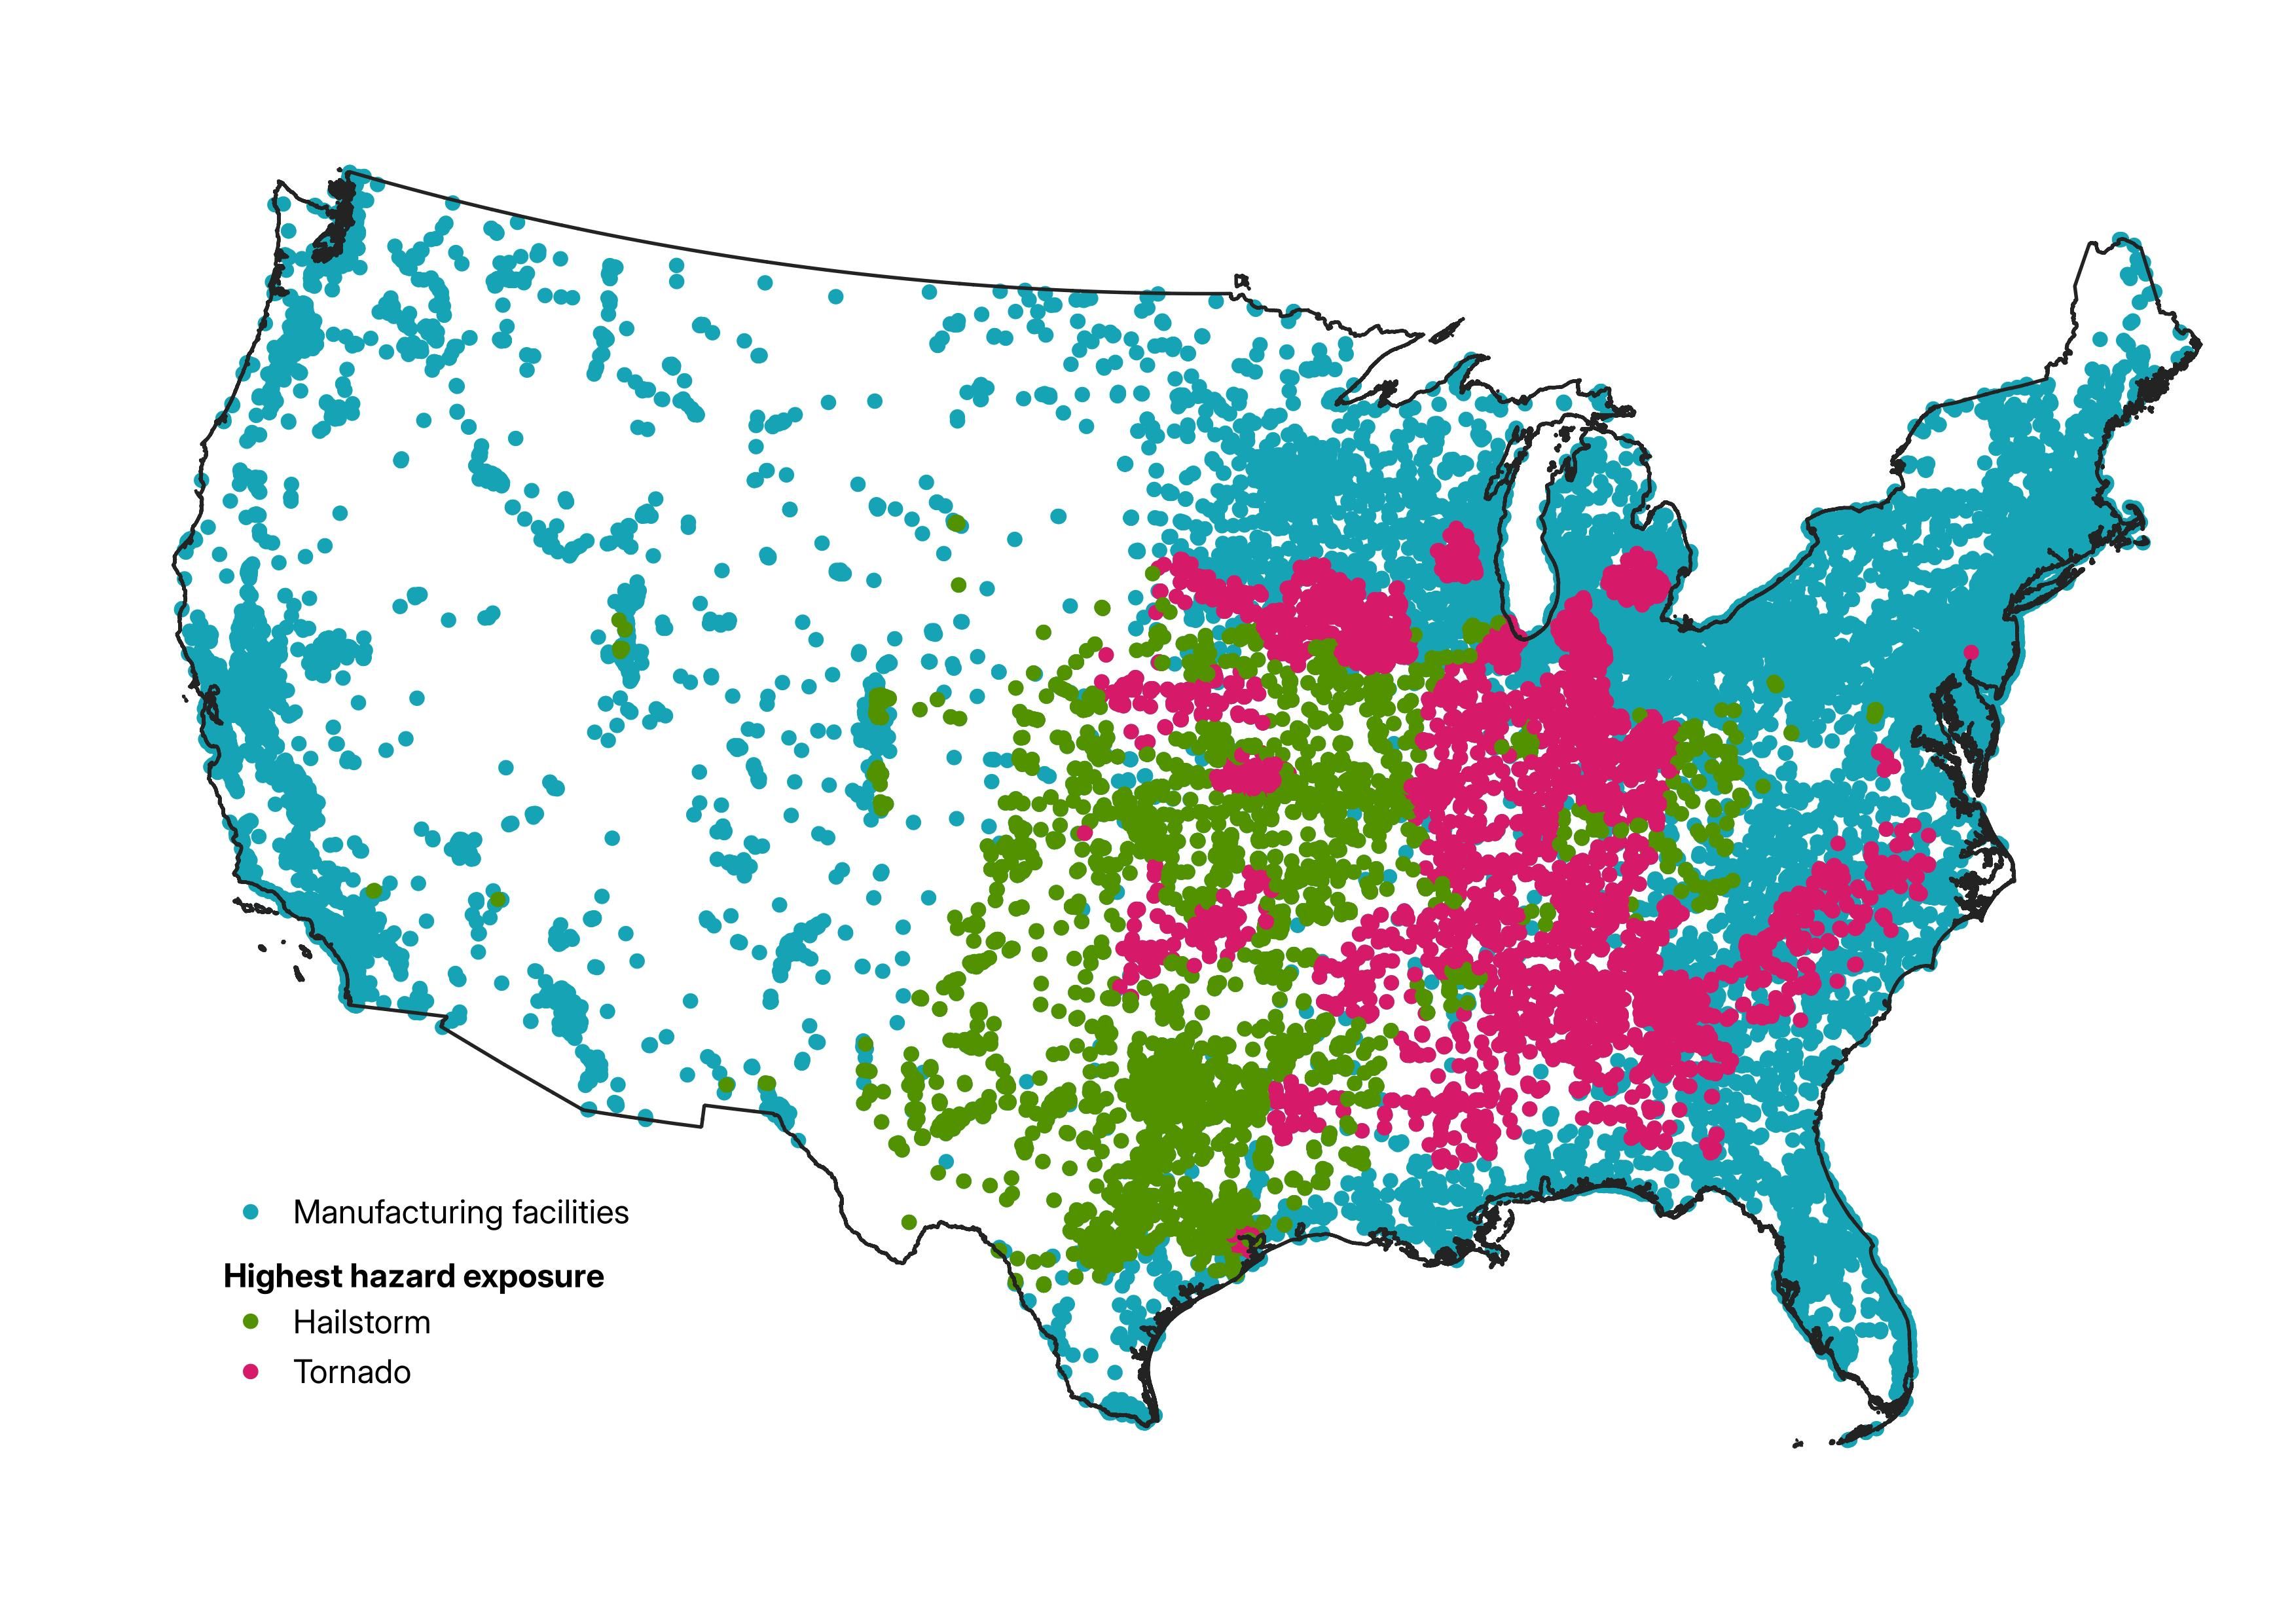
Data as of April 7, 2025. Analysis covers all manufacturing assets, as per MSCI Geospatial Asset Intelligence (gray points), in the U.S. for companies in the following GICS sectors: consumer discretionary, consumer staples, energy, health care, industrials, information technology and materials. Locations with hailstorms (teal points) and tornadoes (blue points) as the hazard that the location has the greatest exposure to, defined as the hazard with the highest hazard percentile under current climate conditions. Source: MSCI ESG Research

Subscribe todayto have insights delivered to your inbox.
Double Trouble: Exposing the Risks of Hurricanes Helene and Milton
Historic estimated losses from two recent hurricanes highlight the importance of understanding asset locations that face intensifying climate impacts.
It’s Getting Hot in Here: Assessing the Risks of Extreme Heat in the US
Chronic heat is causing stress on workers and driving the need for adaptations to current working conditions. Using geospatial intelligence, we assess the potential impact of heat at the asset level for U.S. constituents of the MSCI ACWI Investable Market Index.
1 GICS is the global industry-classification standard jointly developed by MSCI and S&P Global Market Intelligence. GICS sectors analyzed for manufacturing facilities include consumer discretionary, consumer staples, energy, health care, industrials, information technology and materials.
The content of this page is for informational purposes only and is intended for institutional professionals with the analytical resources and tools necessary to interpret any performance information. Nothing herein is intended to recommend any product, tool or service. For all references to laws, rules or regulations, please note that the information is provided “as is” and does not constitute legal advice or any binding interpretation. Any approach to comply with regulatory or policy initiatives should be discussed with your own legal counsel and/or the relevant competent authority, as needed.